Topical drug products are locally-acting therapies typically used to treat skin conditions. Some formulations have solid drug particles suspended in a gel or cream for application onto the skin. Characterising the microstructure of these solid particles can help to rationalise the formulation design and be used to support in vitro bioequivalence in lieu of expensive clinical end-point studies.
EpiduoTM is a topical formulation used for the treatment of common acne. It comprises the two active pharmaceutical ingredients (APIs) adapalene and benzoyl peroxide, which are crystalline particles suspended in a gel for dermal delivery. Using Morphologically-Directed Raman Spectroscopy (MDRS®) on the Morphologi 4-ID, the API components can be automatically and independently characterized within the formulation, providing information for formulation scientists about the microstructure of this product. Traditionally, this may have been achieved by manual microscopy, which is both time-consuming and subjective, especially as it is difficult to distinguish between the particle types from the optical image alone. Further, comparing the component-specific particle size distributions generated for each API between an innovator and generic product may help demonstrate bioequivalence, reducing the need for costly clinical trials.
A sample of the Epiduo gel (a globule with an approximate diameter of 5 mm) was smeared onto a quartz microscope slide underneath a quartz coverslip. To ensure the depth of the sample would be equivalent in subsequent tests, a second slide and coverslip was set up in a clamp with a 25 µm spacer between the slide and coverslip. The slide with the sample was placed in the same clamp next to the slide with the spacer, and pressure was applied by tightening the clamp. The slide was then left to equilibrate. The depth of the sample was therefore set at 25 µm. Figure 1 shows an example field of view image of the Epiduo gel sample between the slide and coverslip.
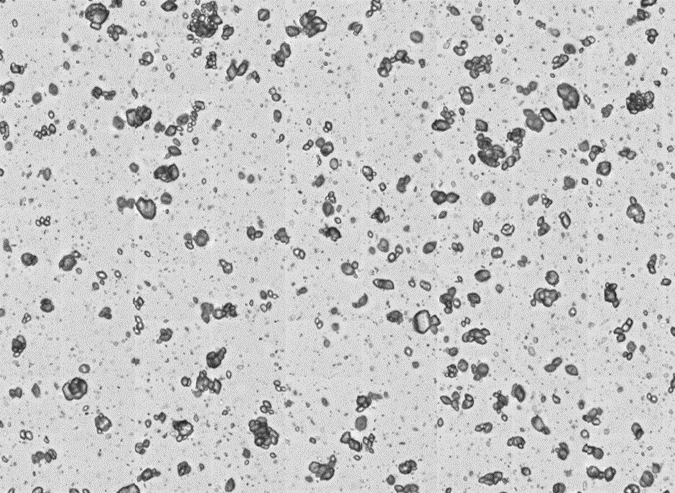
Figure 1: Example field of view image of Epiduo at 50x magnification
Three samples were prepared as described above and analyzed using MDRS with the Morphologi 4-ID. This technique is a fully automated procedure that first scans the sample using image analysis to provide morphological information on the particles, followed by chemical identification of the particles using the integrated Raman spectrometer.
The image analysis was conducted using a 50x magnification objective lens and Sharp Edge image segmentation. Touching particles and incomplete images were filtered out using Convexity (<0.85) and Intensity Standard Deviation (<5.0) filters, to leave between 60,000 to 100,000 particle images from a 30-minute scan time. 4,000 particles with circular equivalent diameters larger than 1 µm were then targeted for chemical identification with the Raman laser at 100% power and a 2-second acquisition time.
From the Raman spectra collected, two components were found, one of which was identified as the API, benzoyl peroxide, using the KnowItAll® library by BioRad. Therefore, it was inferred that the second component was the second API, adapalene. An internal library of the two reference spectra (Figure 2) was set up to enable each particle measured by Raman to be identified as one of the two APIs.
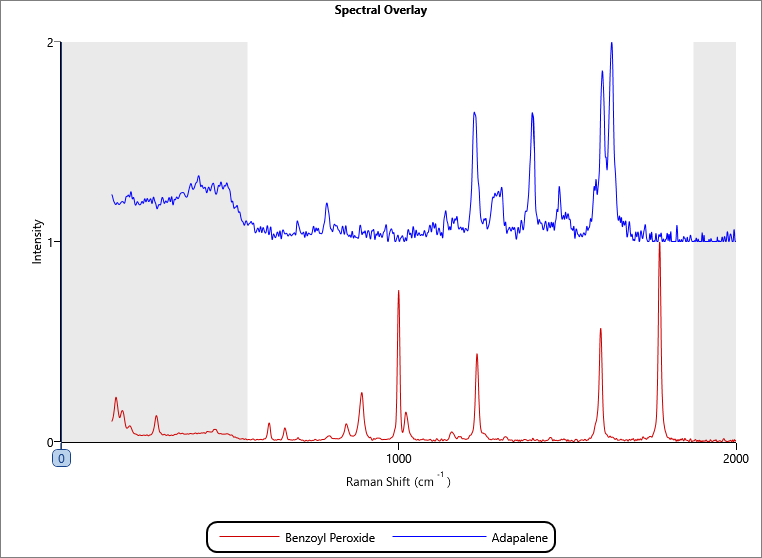
Figure 2: Reference spectral library
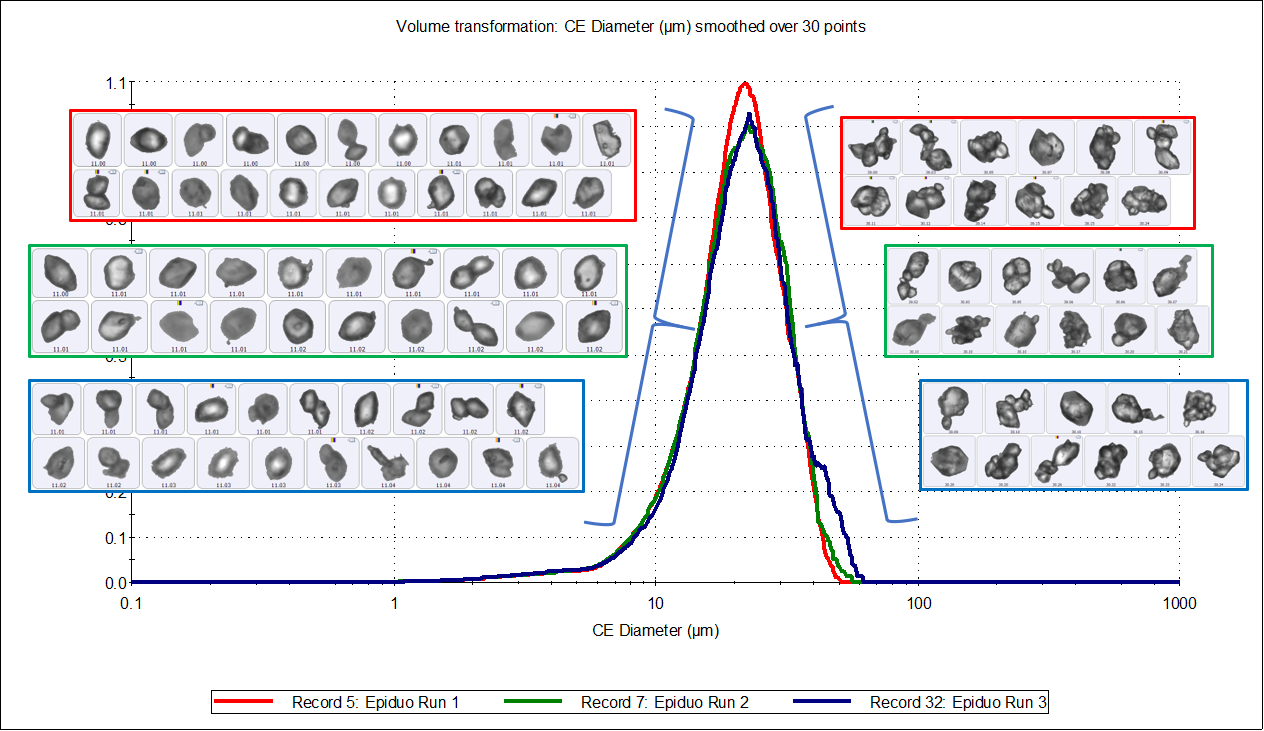
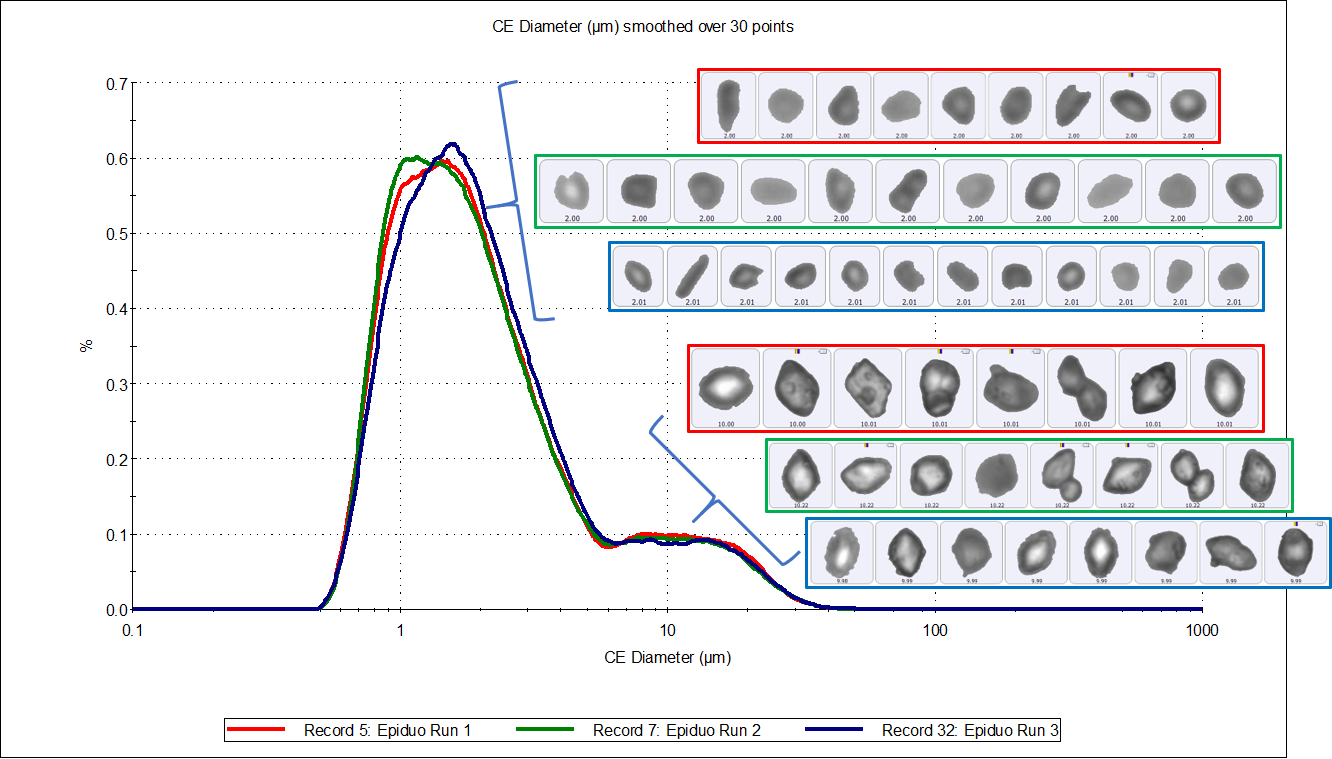
Figure 3 shows an overlay of the circular equivalent particle size distributions, transformed by volume, for the three measurements and a table of results, along with example particle images. The distributions were consistent between runs and appeared slightly asymmetric with an average D[v, 0.5] of 21 µm and a tail to the lower size end. Figure 4 shows the same results displayed by number, but here the distributions appear bimodal, with peaks around 1.5 µm and 10 µm.
|
Run |
D[v, 0.1] |
D[v, 0.5] |
D[v, 0.9] |
|
1 |
11.4 |
20.8 |
32.2 |
|
2 |
11.3 |
21.0 |
33.2 |
|
3 |
11.7 |
21.5 |
35.3 |
|
average |
11.5 |
21.1 |
33.5 |
|
SD |
0.2 |
0.39 |
1.57 |
|
RSD (%) |
1.72 |
1.83 |
4.7 |
Figure 3: Circular Equivalent Diameter distributions by volume of three samples of Epiduo, with a table of results
|
Run |
D[n, 0.1] |
D[n, 0.5] |
D[n, 0.9] |
|
1 |
0.9 |
1.7 |
8.3 |
|
2 |
0.9 |
1.7 |
7.9 |
|
3 |
0.9 |
1.8 |
7.8 |
|
average |
0.9 |
1.7 |
8.0 |
|
SD |
0.02 |
0.05 |
0.28 |
|
RSD (%) |
2.09 |
3.05 |
3.5 |
Figure 4: Circular Equivalent Diameter distributions by number of three samples of Epiduo, with a table of results
The size distributions by number revealed coarse and fine fractions, with substantially fewer particles in the coarse fraction. To investigate the chemical identity of each fraction, two classifications were set, based on particle sizes above and below 10 µm. To give the classifications equal weighting, 2,000 particles from each were targeted for Raman analysis. These classifications were set in the Standard Operating Procedure (SOP) and used in the triplicate runs. The data output from each run contained the chemically analyzed particles, identified as either adapalene or benzoyl peroxide in both the above or below 10 µm size classes.
The three records produced were combined and then separated into four records with the following categories:
• Adapalene particles below 10 µm
• Benzoyl peroxide particles below 10 µm
• Adapalene particles above 10 µm
• Benzoyl peroxide particles above 10 µm
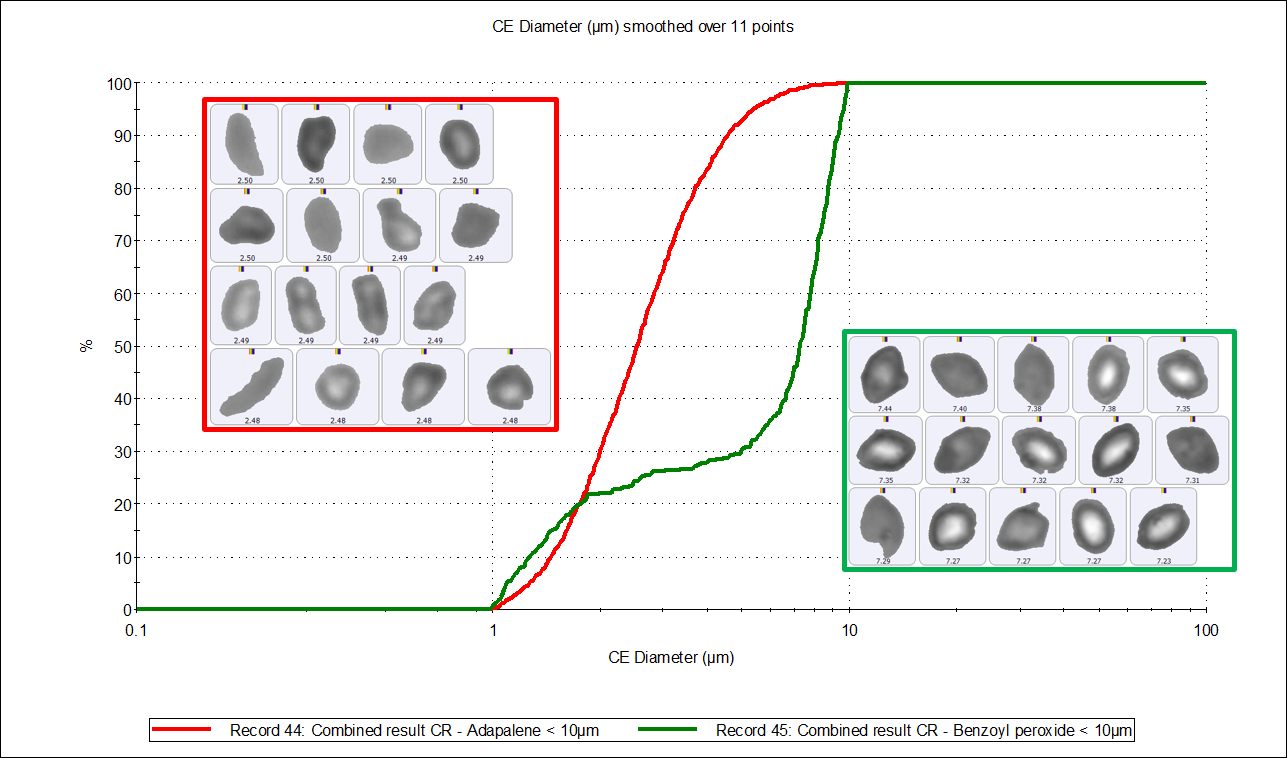
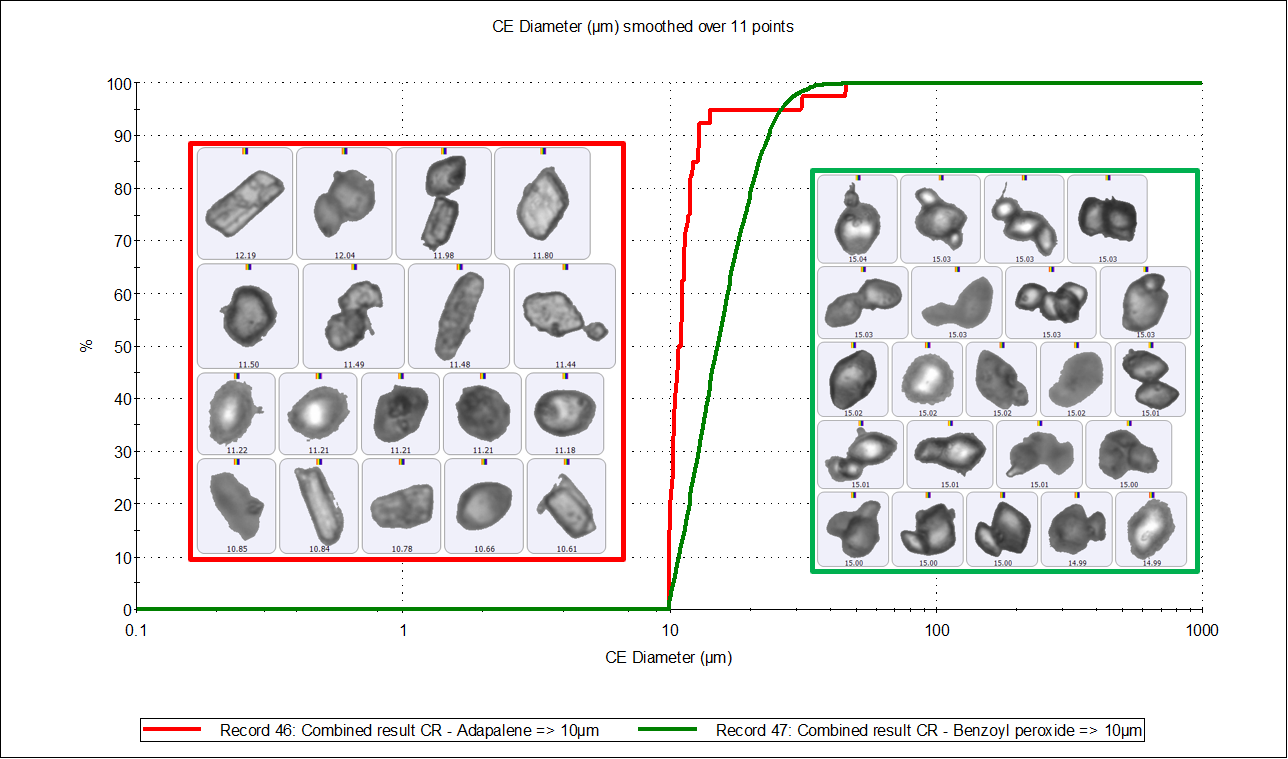
Figure 5 shows the particle size undersize charts of adapalene and benzoyl peroxide, above and below 10 µm, with a table of results. The benzoyl peroxide particles (green line) in both size ranges are to the right of the adapalene particles (red), which confirms that benzoyl peroxide particles are larger than adapalene particles. The particle count data also shows that there are significantly fewer benzoyl peroxide particles in the smaller size range and significantly more in the larger size range than adapalene particles. This adds to the general observation that benzoyl peroxide particles are larger in size than adapalene particles.
|
Component |
Particle number < 10µm |
Particle number > 10µm |
|
Adapalene |
1828 |
40 |
|
Benzoyl peroxide |
343 |
4883 |
Figure 5. CE diameter undersize charts by number of adapalene particles (red distribution) and benzoyl peroxide particles (green distribution) below 10 µm (top) and above 10 µm (bottom). The table contains the number of particles chemically identified in each size range.
From the particle images, the adapalene particles appear mostly primary, whereas the benzoyl peroxide particles appear to be significantly agglomerated in the upper size range. Figure 6 compares the Solidity distributions of the two APIs - this is sensitive to irregularly-shaped and agglomerated particles. The lower solidity values of benzoyl peroxide particles indicates a higher degree of agglomeration, which was confirmed from the corresponding particle images.
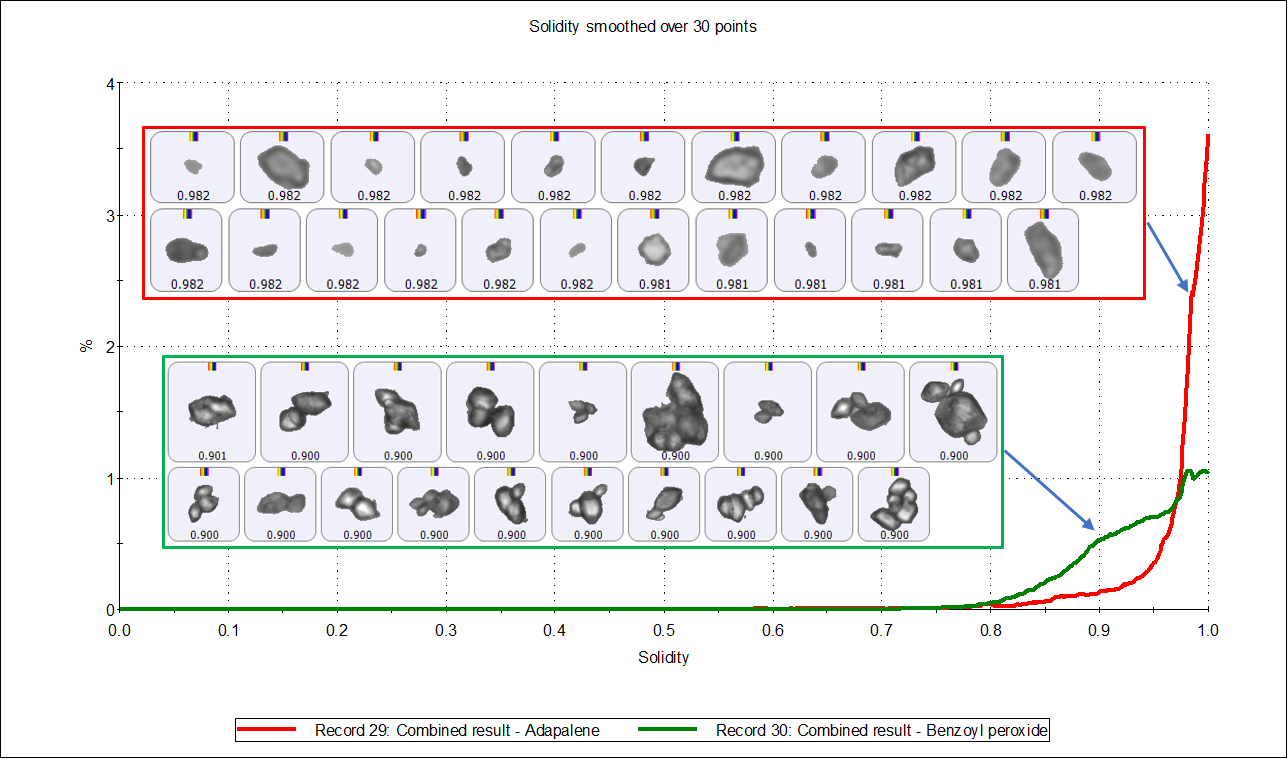
Figure 6. Solidity distribution by number of adapalene particles (red distribution) and benzoyl peroxide particles (green distribution).
Epiduo is a locally-acting product developed to treat skin conditions and is applied once daily. Adapalene’s mode of action is to unclog hair follicle pores in a process known as comedolysis [1], which subsequently enables the antibacterial, benzoyl peroxide, to access the pores and treat the inflammation. There is some evidence that application of adapalene a few minutes prior to application of an antimicrobial drug can improve the efficacy of the treatment [2].
Epiduo comprises 0.1% w/w of adapalene and 2.5% w/w of benzoyl peroxide. The comparatively smaller particle size of adapalene will have a higher surface area to bulk ratio and so enable a fast and immediate release of the dose to unclog the skin pores and allow the benzoyl peroxide particles to access the pores. Benzoyl peroxide is comparatively greater in quantity and larger in particle size than adapalene, leading to a more sustained release until the next dose, 24 hours later.
Understanding the particle morphology of each API in a combination product could be key to unlocking equivalent efficacy for a generic product, which could help to find a path to bioequivalence.
Whilst the size range classes are useful to ensure chemical analysis of comparative numbers of large and small particles, this also places an artificial bias on the true size distribution. A future development of this method would be to remove the size range classifications and analyze all sizes at random to give a more accurate representation of the sample. The outcome from this would enable the measurement of size distributions from both APIs, which could subsequently be used for in vitro Q3 bioequivalence studies as has been described in the draft guidance for other topical products including acyclovir, silver sulfadiazine, dapsone and docosanol [3]. Here, the guidance advises that an in vitro option for bioequivalence is possible if the test and reference product can be demonstrated to be physically and structurally the same through “analysis of particle size distribution and crystal habit with representative microscopic images at multiple magnifications”.
Using MDRS, the particle size distributions of the two APIs adapalene and benzoyl peroxide were individually and reproducibly measured from within the Epiduo topical product. Significant differences between the two APIs’ particle sizes were found, which may be critical to the design of the formulation. In this case, specifications based on the MDRS data may be set for the individual APIs, which would not be possible from the imaging data alone.
1. J.B. Bikowski, Mechanisms of the comedolytic and anti-inflammatory properties of topical retinoids, J. Drugs. Dermatol., 2005, Jan-Feb, 4(1), 41-7.
2. G.K. Jain, F.J. Ahmed, Adapalene pretreatment increases follicular penetration of clindamycin: In vitro and in vivo studies, IJDVL, 2007, 73, 5, 326-329.