precision, accuracy, resolution, min concentration, max concentration, fluorescence, scattering angle, intensity-volume, hydrodynamic radius, Rh,radius of gyration, mw from DLS
Dynamic light scattering (DLS) is an analytical technique used to measure the particle size distribution of protein formulations across the oligomer and sub-micron size ranges of approximately 1 nm to 1 µm. The popularity of DLS within the biopharmaceutical industry is a consequence of its wide working size and extended sample concentration ranges, as well as its low volume requirements. With that said, the challenge that remains with the application of DLS to protein therapeutic formulations is centered around data interpretation. In this four-part white paper series, common issues and questions surrounding the principles, measurements and analysis of DLS data are discussed in order to help minimize the time required for and complexity of acquiring and interpreting DLS data that is critical throughout the development process. In this fourth white paper of the series, we address frequently asked questions related to the application of DLS to the characterization of protein therapeutic formulations.
Dynamic light scattering (DLS) is an analytical technique used within bioapplications to measure particle size distributions across the oligomer and sub-micron size ranges. In a DLS measurement, scattering intensity fluctuations are correlated across small time spans, yielding a distribution of diffusion coefficients, which is subsequently converted into an intensity weighted particle size distribution using the Stokes-Einstein equation.
Over the past few decades, DLS has transitioned from an esoteric academic R&D tool into a mainstream technology routinely used for purposes such as protein aggregate screening and bioformulation stability & stress testing. This transition has not been absent of challenges, particularly in the area of data interpretation, and as the technology is introduced into more and more new application areas, the importance of recognizing the limitations of DLS cannot be overstated. This document addresses frequently asked questions regarding DLS data interpretation, including:
The precision or repeatability of a DLS measurement is dependent upon the property being monitored. The most robust property derived from a DLS measurement is the Z average size, which is calculated directly from the decay rate of the intensity correlation function, using known physical constants and sample/instrument properties. The robustness of the intensity weighted Z average also makes it the most repeatable of the various sample properties derived from a DLS measurement.
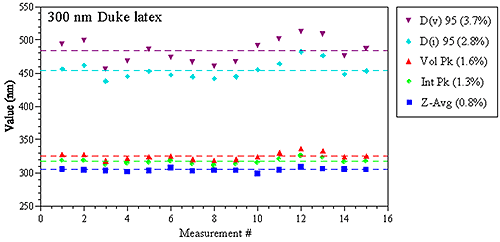
Figure 1 shows a comparison of various DLS-derived intensity and volume based parameters for repeat measurements of a 300 nm latex standard in a Malvern Zetasizer Nano ZS system, with the values in parentheses being the relative standard deviation of the 15 measurements. As noted in these results, the Z average size derived from DLS has a precision of better than 1%.
|
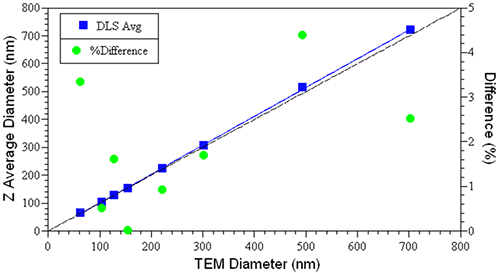
The Z average size derived from a DLS measurement is the intensity-weighted hydrodynamic size of a particle. As implied by the definition, the Z average is influenced by hydration or solvation effects. Transmission electron microscopy (TEM), the technique generally used to confirm the size of latex standards, produces a number-weighted average size of a dehydrated hard sphere. Despite the subtle differences in the measured parameters, accuracy in DLS measurements is often quoted in relation to TEM-validated latex sizing standards.
Figure 2 shows a comparison of the TEM and hydrodynamic sizes measured for a series of NIST-traceable latex sizing standards, along with the relative differences between the two values. As noted in this figure, the difference is always < 5% and generally < 2-3%, with the DLS value always being a little larger, due to the hydration effects discussed above.
|
In DLS, the particle size distribution is derived from a measurement of the Brownian motion of an ensemble collection of particles. Deconvolution of the measured correlogram is considered an ill-posed problem, in that small amounts of noise can significantly influence the resulting particle size distribution. DLS therefore, is considered a low resolution technique.
The theoretical limit for DLS baseline resolution of a mixture of components is 1.7x difference in particle size. In practice, this limit is found to be about double the theoretical value, or to be roughly 3x difference in size. So while one could easily resolve a mixture of 10 nm and 30 nm latex spheres, a mixture of 10 nm, 20 nm, & 30 nm latexes would appear as a very broad distribution in a DLS measurement. From the standpoint of resolving oligomeric protein mixtures, the 3x size limit translates to about 12x difference in molecular weight. So in the absence of physical separation via an SEC-type technique, protein oligomeric distributions cannot be resolved by DLS.
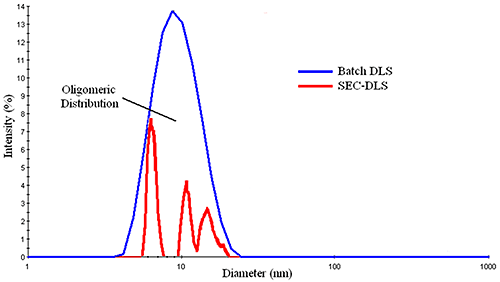
Figure 3 shows a comparison of the DLS distributions measured for a mixture of BSA oligomers in batch and flow modes. The SEC-separated measurement shows three principal components, with diameters of ~ 6.4 nm, 10.0 nm, & 11.5 nm, corresponding to the monomer, dimer, and trimer, while the batch measurement shows a broad distribution, with a mean of about 9 nm. With that said, for samples consisting of a single particle family, the typical %Pd or %polydispersity is around 15%, where %Pd is defined as the relative standard deviation of the peak (= σ / Mean). This rule of thumb value is routinely used to distinguish peaks composed of multiple components from those containing a single family of particles. So while DLS cannot resolve oligomeric components, the width of the measured distribution can provide qualitative information regarding the oligomeric composition of a sample.
|
The minimum required sample concentration for DLS measurements is dependent upon a number of instrumental and sample properties. Instrumental properties include the size of the scattering volume, the laser power and wavelength, the scattering angle, and the sensitivity of the detector - all of which can influence the intensity or magnitude of the scattering signal. Sample properties include the analyte's molecular weight and partial specific volume.
The noise in the correlation curve varies as the inverse square root of the total number of analyte-scattered photons counted during the sample time (Jakeman, Pike, & Swain, Journal of Physics A 1971, V4, 517-534). In order to achieve an acceptable signal-to-noise ratio for a DLS measurement, at least 1 million residual photons should be counted during the timeframe of the measurement, where residual = sample - solvent.
The analyte's scattering intensity varies with its molecular weight. As such, the minimum required sample concentration to achieve the 1 million photon limit decreases with increasing molecular weight. In other words, the minimum sample concentration for larger particles is lower than that for smaller particles. The partial specific volume of the particle will also influence the scattering intensity. Globular or compact molecules scatter much more strongly than expanded or random coil type molecules of identical molecular weight. So the minimum sample concentration for a fixed optical configuration and particle molecular weight is lower for globular molecules, compared to random coil molecules.
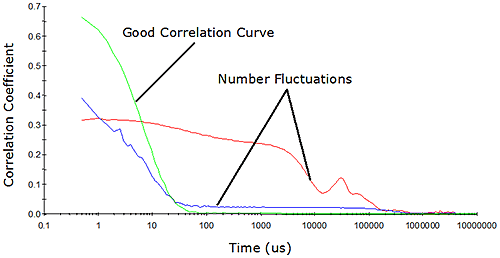
While the million residual photons approach defined by Jakeman et al. is satisfactory as far as signal-to-noise is concerned, one must also consider the limits defined by the geometry of the system. In dynamic light scattering, the number of particles observed during the course of the measurement must be constant. As the concentration is decreased, the probability of maintaining a constant number concentration diminishes. Eventually, the numbers will fluctuate, resulting in erroneous results. Number fluctuations are generally easy to spot in DLS measurements, and are often manifested as elevated baselines in the measured correlogram (Figure 4).
|
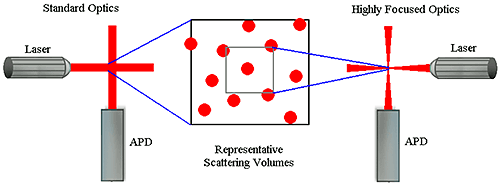
Number fluctuations are particularly problematic with DLS instruments utilizing focused optics to increase sensitivity. In order to produce a high power density in the scattering volume, the laser and detector optics in these types of systems are focused to narrow diameters. While this increases the system's sensitivity to sample concentration, the smaller scattering volume also increases the likelihood of number fluctuations if larger particles are present (Figure 5). As a consequence of the smaller scattering volume, the upper size limit for measurements with these systems is significantly lower than that of non-focused optical systems.
|
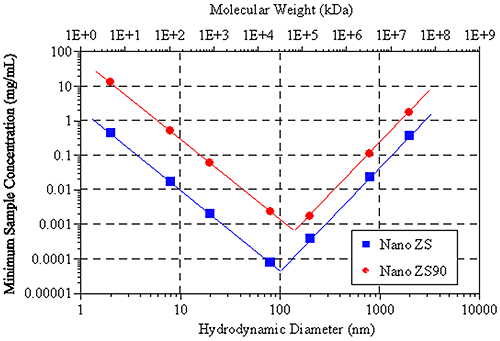
Figure 6 shows the hydrodynamic size (and molecular weight) dependence of the minimum required sample concentration for DLS measurements of globular protein samples, with the Zetasizer Nano ZS and ZS90 systems. Notice the V shape of the data. For small particles (left leg of V), the minimum concentration limits are controlled by the signal-to-noise ratio, while the limits for larger particles (right leg of V) are controlled by number fluctuations.
|
When considering number fluctuations, a typical follow up question is whether it is necessary to filter samples prior to measurement. The answer to that question depends upon the angle of measurement for the DLS system and the information one is attempting to gather from the measurement.
Factors that can lead to number fluctuations include the presence of trace amounts of dust or large sample particles, or low sample concentrations. The latter is a factor that can only be addressed by increasing the sample concentration. With regard to dust and large sample particles, such as sub-micron or even sub-visible particles, spinning the sample in a benchtop centrifuge for about 20 minutes will often remove the particles generating the number fluctuation problem.
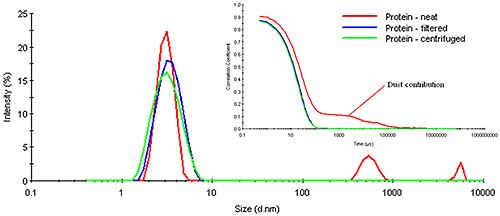
Consider Figure 7 for example, which shows a comparison of the measured correlograms and particle size distributions for a dust-contaminated protein sample measured neat, after filtration using a 0.45 µm filter, and after centrifugation for 10 minutes at 3000 rpm in a benchtop microcentrifuge. As evident in this figure, the number fluctuation caused by the presence of dust is completely removed in both the filtered and centrifuged samples. The removal of the dust is confirmed in the size distribution results, which show no indication of any particles larger than the primary particle family at circa 6 μm. Note, however, that the removal of the dust also has very little effect on this primary particle size peak. In other words, the size measured for the primary particle is the same, whether the sample is filtered, centrifuged, or measured neat.
|
The question of whether or not one needs to filter samples prior to measurement also depends upon the detection angle. Large particles scatter more strongly in the forward direction. Modern DLS systems utilize backscatter optics. In the backscatter mode, the scattering from large particles is strongly attenuated in comparison to the forward scattering angles. As such, the presence of dust is less catastrophic when measured with a backscatter configuration, as opposed to the traditional 90 degree optical configuration. In fact, the quality of the signal from the smaller particle family in Figure 7 is a direct consequence of the dust's attenuating effect on the backscatter optical configuration in the Zetasizer Nano ZS.
There are a number of issues that need to be considered when attempting DLS measurements of concentrated samples, e.g. restricted diffusion effects, particle interactions, and multiple scattering. It is the latter that is used to define the maximum concentration for DLS measurements.
In traditional DLS measurements, single scattering is assumed, meaning that every photon reaching the detector is scattered by only one particle. As the sample concentration is increased, the probability of the scattered photon being re-scattered by neighboring particles increases. This phenomenon is defined as multiple scattering. The presence of multiple scattering during a DLS measurement will lead to erroneous results, with an apparent size that is smaller than the physical size of the particle being measured. Backscatter optical configurations reduce the probability of multiple scattering by making the measurement near the surface of the cell. As a consequence, DLS systems utilizing backscatter optics can often operate at concentrations significantly greater than those for traditional 90 degree systems.
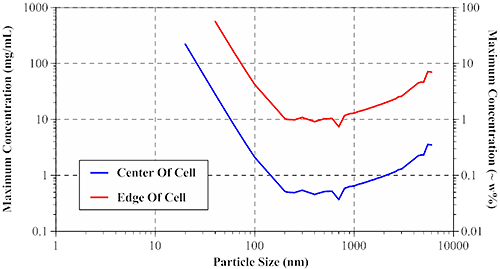
The size-dependent maximum sample concentration for single scattering can be derived from a random walk model and Mie theory. The results of these calculations are presented in Figure 8, which shows the maximum sample concentrations, for center and edge-of-cell measurements, for globular protein type particles using a 633 nm Zetasizer Nano ZS system.
|
For smaller particles (left leg of V in Figure 8), the maximum concentration limits follow the diameter cubed dependence expected for Rayleigh scatterers. For larger particles (right leg of V), the limits are controlled by anisotropic Mie scattering effects, with the upper concentration limit following roughly a diameter to the 2/3 dependence. The local minima and maxima in the data, in the 0.2 µm to 1 µm region, are a result of internal resonances, which are most significant when the particle size is close to the laser wavelength.
Given the high concentration limits afforded by edge-of-cell measurements in a backscatter system, new users often question why all measurements are not conducted at the edge of the cell. The answer is two-fold: 1) edge-of-cell measurements reduce the scattering volume, thereby reducing the sensitivity at low concentrations, and 2) flaring noise can be significant in edge-of-cell measurements of weakly scattering samples.
Flaring is a term used in light scattering to describe a scenario wherein a portion of the incident light beam is reflected into the detection optical path. This reflected light manifests itself as noise in the DLS signal, often leading to the generation of erroneous size peaks in the > 1 µm size region.
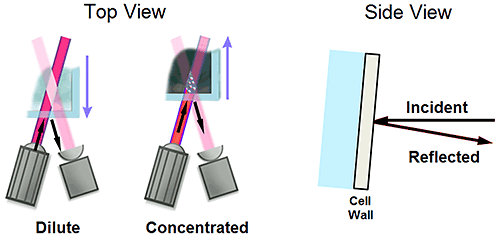
Figure 9 shows a schematic of the measurement position limits for a backscatter optical system, with the arrows indicating the path of the incident and reflected light beams. Under dilute sample conditions, wherein the measurement zone or scattering volume is positioned in the center of the cell, flaring is minimized, due to lack of alignment of the reflected beam with the detection beam. Flaring is further minimized by integrating a slight tilt in the measurement cuvette to direct the reflected light away from the source/detector plane. Under concentrated sample conditions, wherein the scattering volume is positioned near the surface of the cuvette to minimize multiple scattering, the reflected and detection beams are more closely aligned, increasing the probability of flaring. With that said, flaring manifests itself in the DLS results as noise, and under concentrated sample conditions the magnitude of flaring noise is insignificant in comparison to the scattering from the sample itself.
|
As indicated above, flaring noise is generally negligible for highly concentrated and strongly scattering samples. For water-clear samples however, as is often the case for biologics, the assumption of negligible flaring noise during edge-of-cell measurements is problematic.
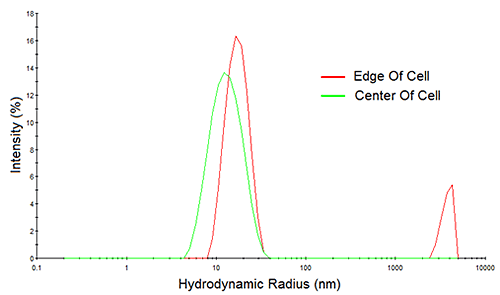
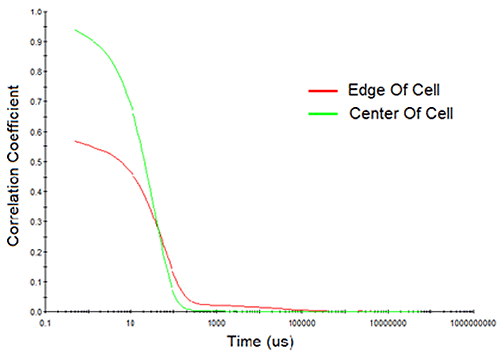
Consider Figure 10 for example, which shows the measured correlation curves and intensity particle size distributions for a > 200 mg/mL mAb sample, measured both at the edge of the cell and at the center of the cell. Note first, the reduction in the intercept in the correlogram and the indication of a 2nd decay in the 10,000 µs delay time range for the edge-of-cell measurement. Both of these observations are indicative of flaring, which manifests itself in the size distribution results as a spurious peak in the > 1 µm size region. In contrast, the center-of-cell measurement shows a strong correlogram intercept, with no indication of a 2nd decay in either the correlogram or the intensity particle size distribution results. So when working with water-clear biological samples, center of the cell measurements are always recommended, in order to avoid flaring effects.
|
|
There are two types of photons detected during the course of a DLS measurement: those scattered by the analyte and those scattered by the solvent. Dilute samples are characterized as those where the solvent scattering is large compared to that of the analyte. Under these conditions, statistical fluctuations in the count rate will add noise to the correlogram, leading to variations in the repeatability of the measurement.
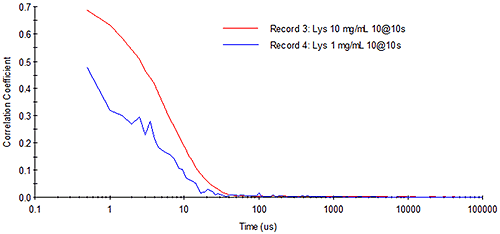
Consider Figure 11 for example, which shows DLS correlograms for 10 mg/mL and 1 mg/mL lysozyme samples. At high concentration, the correlogram exhibits a smooth exponential decay. With the same total measurement time at low concentration, however, the intercept of the correlogram is diminished and the noise due to the low analyte signal level is increased.
|
In DLS, the signal-to-noise (S/N) ratio is defined as shown below, where the amplitude is the intercept of the correlation curve and the baseline is the correlation coefficient in the limit of t = ∞. The theoretical limit for the correlation coefficient is 1, which gives us an S/N ratio range of 0 to 1.

|
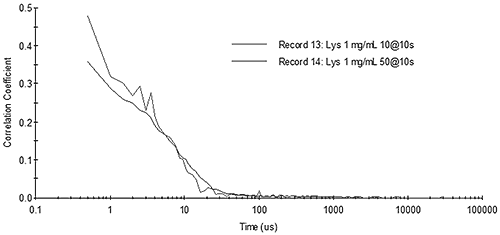
It is noted here that the noise defined by the baseline in the above equation is different from the noise in the correlation curve discussed earlier, even though the source of the noise is the same. With regard to transforming the correlation curve into a size distribution, it is the noise in the correlation curve that is the most problematic. Consider the figure below for example, which shows correlograms for the low concentration lysozyme sample collected with a different number of runs. While the S/N ratios for the two measurements are roughly the same, signal averaging has decreased the noise in the correlogram for the 50 run measurement.
|
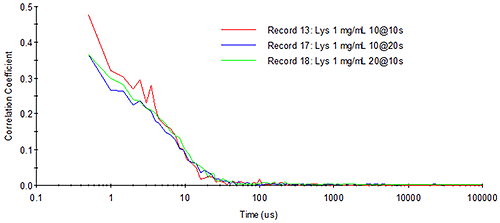
With regard to decreasing the noise in the correlation curve by signal averaging, there are two approaches that can be employed: increasing the acquisition (or run) time, or increasing the number of runs averaged during the measurement. In the short delay region of the correlation curve (1 µs to 10 µs), signal averaging is achieved faster by collecting more runs during the measurement. In the longer delay time region of the correlogram (100+ µs), signal averaging is achieved faster by increasing the run time. So the best approach to use is dependent upon the size of the particle being measured. For small particles, it is better to increase the number of runs; for large particles, it is better to increase the run time.
Figure 13 shows the correlograms for 1 mg/mL lysozyme collected under different measurement time conditions. As predicted above, for small particles such as proteins measured with a fixed total measurement time, noise in the correlogram is averaged out faster by increasing the number of runs collected during the measurement (20 runs at 10 seconds each), as opposed to increasing the run time (10 runs at 20 seconds each).
|
There is a downside, however, to longer run times. At longer acquisition times, the likelihood of a dust particle entering the measurement zone is significantly increased. When this happens, the correlation curve shifts upward, and baseline evaluation becomes problematic. As a rule then, acquisition time should be kept as short as possible, whilst observing the noise in the correlation curve and the baseline values.
Fluoresced light is non-coherent. As such, fluoresced light, if present during a DLS measurement, will be manifested as noise in the correlogram. The important question to consider, though, is whether or not fluoresced light is actually present.
In order for a sample to fluoresce light, it must first absorb light. As a consequence of vibrational relaxation, fluoresced photons are emitted at a lower energy or longer wavelength than that of the absorbed photons. Scattered photons, on the other hand, have roughly the same wavelength as the incident photons. If only detecting the photons with the same frequency as the incident light, fluorescence would have negligible influence on light scattering measurements. In practice, however, DLS systems typically utilize avalanche photodiode (APD) detectors, and APDs exhibit significant sensitivity to photons across a broad range of wavelengths.
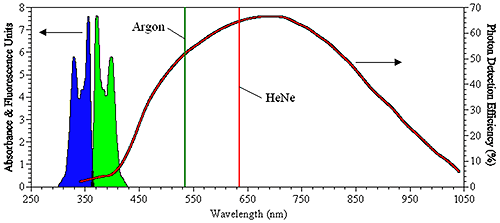
As an example, consider Figure 14, which shows the representative absorbance and emission spectra of the fluorophore, pyrene, along with the wavelength-dependent photon detection efficiency for an APD. The pyrene absorbance spectrum (represented in blue) exhibits a maximum absorbance at circa 350 nm. The emission spectrum (represented in green) exhibits the classic mirror image profile, with an emission maximum at circa 370 nm. As noted on the right axis in the figure below, the detection efficiency is non-zero in the 350 nm to 400 nm range for the APD. So while the photon detection efficiency would be low, the APD would still be capable of measuring the light scattered from a 350 nm source. However, if the particle being sized with the 350 nm source contained pyrene, then some of the incident light would be absorbed and re-emitted at a longer wavelength, where the APD has an improved photon detection efficiency; and under the scenario defined here, it would be a mistake to treat the amount of fluoresced light as insignificant. Since the fluoresced light would be non-coherent, the likely result is that it would manifest itself as baseline noise in the DLS-measured correlogram, resulting in a decreased signal-to-noise ratio and reduced confidence in the size distribution results.
|
Also shown in the figure above are the wavelengths of the typical lasers employed in DLS systems, e.g. the green 532 nm Argon laser and the red 633 nm HeNe laser. As evident in the absorbance spectrum, the use of either of these incident light sources would ensure the absence of absorbance by pyrene, thereby eliminating any fluorescence. The availability of fluorophores absorbing in the 500 nm to 650 nm range, however, has increased significantly in the past decade, particularly within the quantum dot field. In fact, the wavelength at which a quantum dot fluoresces is very strongly dependent upon the particle size, and since these sizes are typically sub-micron, the question of fluorescence effects on DLS results has taken on new importance.
Two issues on the subject of fluorescence effects on DLS results that need to be considered are noise and sensitivity. In DLS, sensitivity is defined as the minimum concentration at which a particle of a defined size can be measured. For a fixed optical geometry, the sensitivity of a DLS system is strongly correlated to the number of photons being scattered. Photons absorbed in the fluorescence event will not scatter. So if the particles being measured in a DLS experiment absorb some of the incident light, an inherent loss of sensitivity will be observed. The magnitude of this loss will depend upon the quantum efficiency of the absorbance mechanism. With regard to noise, fluoresced light, as mentioned above, is non-coherent. As such, fluoresced light detected in a DLS experiment will be manifested as baseline noise in the measured correlogram.
The reduced data quality arising from fluorescence effects can generally be improved by increasing the sample concentration, which increases the number of scattered photons, and/or increasing the number of runs, which increases the signal-to-noise ratio, collected during the measurement.
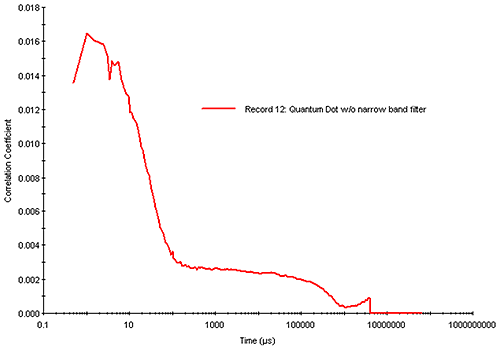
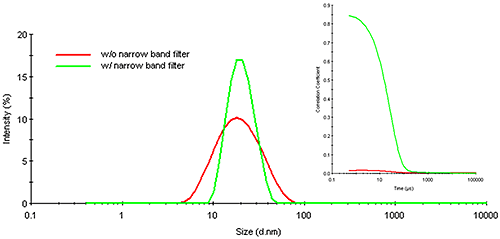
There are examples, of course, where increasing the run time or sample concentration is ineffective. One example would be a small particle, which absorbs strongly at the wavelength of the incident laser and fluoresces strongly in the wavelength range of high APD photon detection efficiency, e.g. a sample that absorbs at circa 630 nm and fluoresces in the 650 nm to 850 nm range. Figure 15 shows the correlogram measured with a Zetasizer Nano (633 nm laser) for a 20 nm diameter quantum dot sample exhibiting strong absorbance in the 630 nm range and strong fluorescence in the 800 nm range. For high quality DLS measurements, one would target a correlogram intercept of > 0.8. As indicated in Figure 15, however, the combination of reduced scattering intensity and increased noise leads to a measured correlogram with a low intercept (0.016) and a noisy baseline. While it is possible to deconvolute a particle size distribution from this correlogram, confidence in the results would be low.
|
For scenarios such as the one described above, insertion of a narrow band wavelength filter between the scattering sample and the APD can often improve data quality. The narrow band filter functions to remove much of the non-coherent fluoresced light, allowing only scattered photons, with a wavelength similar to that of the incident source, to reach the detector - thereby reducing the level of noise in the detected signal.
Figure 16 shows an overlay of the correlograms and resultant particle size distributions for the quantum dot sample cited above, measured in the presence and absence of a narrow band wavelength filter. As noted in this figure, the presence of the filter significantly enhances the quality of the measured correlogram, showing negligible baseline noise and an intercept (0.85) well within the acceptable range for high confidence results. This confidence is supported by improvements in the particle size distribution, which shows a decrease in polydispersity (peak width) and a size that is consistent with the reported 20 nm quantum dot diameter.
|
The influence of detection angle on DLS results is dependent upon two factors: 1) the size of the particles being measured, and 2) the polydispersity or relative composition of the sample.
For particles much smaller than the wavelength of the incident light, the scattering is isotropic - which means that the scattering intensity within the plane perpendicular to the plane of the incident light is independent of the angle of detection. The rule of thumb upper diameter limit for isotropic or Rayleigh scattering is ~ λ/10, where λ is the wavelength of the incident light. For particles larger than the Rayleigh limit, the scattering is influenced by the optical properties of the particle, leading to internal resonances and asymmetric scattering profiles, as indicated in Figure 17.

|
For monomodal samples consisting of a single particle size family, no angular dependence would be expected in DLS results because all of the particles scatter equally at whichever angle is being used. The same can be said for mixtures of isotropic scatters, since all particles within each size family would scatter equally at all angles. For mixtures of anisotropic scatterers, however, the results in Figure 17 suggest the potential for a strong angular dependence in DLS results.
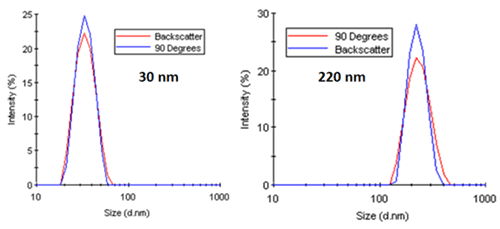
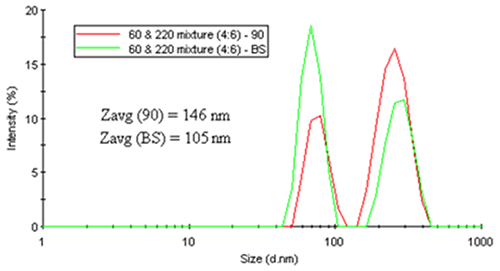
As a working example, consider Figure 18. The two figures on the left show the intensity particle size distribution results for monodisperse latex spheres of 30 nm and 220 nm diameter measured at 90 degree and 173 degree scattering angles. As noted in both of these distributions, there is no angular dependence, with both systems generating nearly identical results. Conversely, the right figure shows a distinct angular dependence in the intensity-weighted size distribution results for a mixture of latex spheres (60 nm and 220 nm).
|
|
It is instructive to note here that while the relative intensities for the latex mixture show an angular dependence, the sizes for the two latex particles measured at 90 and 173 (backscatter) degrees are consistent. But with regard to an average size value, the intensity-weighted Z average shows the expected angular dependence arising from differences in the relative scattering intensities of the two peaks.
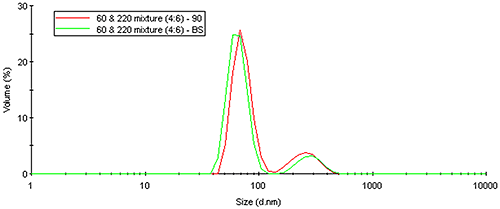
The same Mie theory that predicts an angular dependence of light scattered from large particles can also be used to correct for intensity-weighting effects. Figure 19 shows the volume distribution derived from a Mie theory transform of the measured intensity distribution for the latex mixture results shown above. As evident in this figure, the volume transform normalizes the intensity weighting effects, yielding results that are independent of the scattering angle.
|
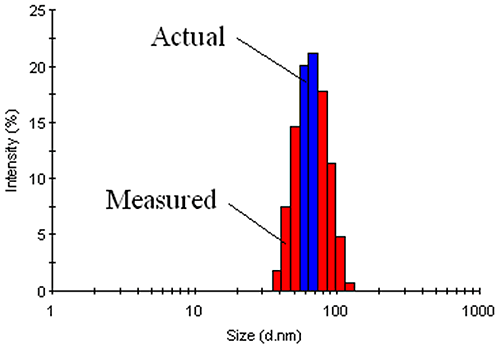
The measured data in a DLS experiment is the intensity autocorrelation curve. Deconvolution of the intensity autocorrelation curve to an intensity distribution is an ill-defined problem. As such, there is an inherent degree of uncertainty in DLS-derived intensity size distributions. This inherent uncertainty translates into peak broadening or an apparent increase in the width of the intensity distribution. For typical laboratory samples, this increase can be as great as 10% - 15%. Unfortunately, it is very difficult to distinguish 'inherent' polydispersity from true polydispersity effects arising from physical differences in the diffusing particles (Figure 20).
|
The scattering intensity varies with the 6th power of the size. Intensity-weighted size distributions then, appear to amplify the amount of larger particles, in comparison to a mass- or volume-weighted distribution. While the intensity distribution is actually correct and appropriate for an intensity-based DLS measurement, it tends to be visually unappealing to researchers more familiar with mass-weighted distributions. So the prospect of an intensity to mass transform is difficult to refuse, and Mie theory can be used to perform just such a transform. When performing this transform, however, it must be remembered that the algorithm cannot distinguish true polydispersity from apparent polydispersity, with each histogram size bin being treated as though it is real, i.e. a fraction of the sample that has a slightly different size from that of the mean.
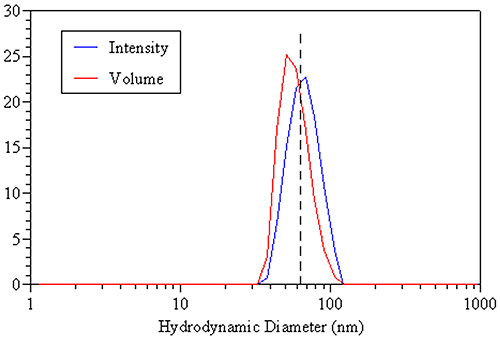
A comparison of the DLS-derived intensity and volume distributions for the 60 nm latex standard discussed earlier is shown in the figure below. The dashed line represents the true hydrodynamic size of the monodisperse sample and is consistent with the mean of the intensity distribution. The volume distribution, on the other hand, gives a mean value that is smaller than the true value, due solely to the small amount of inherent peak broadening associated with the DLS technique. So when working with monodisperse samples, the intensity-weighted size is the appropriate value to report.
|
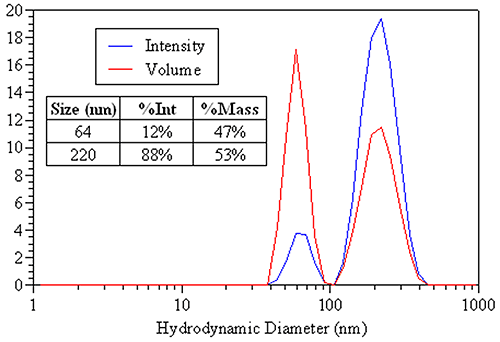
A more appropriate use of DLS-derived volume distributions is in the area of sample composition. Figure 22 shows the DLS-derived intensity and volume distributions for an equal mass mixture of 60 nm and 220 nm latex spheres. The appropriate sizes to report are those from the intensity distribution (table inset). The area under each peak is proportional to the relative amount of each particle family. By intensity, 88% of the distribution contribution is from the larger 220 nm particles. The mass distribution, however, is much more consistent with the known equal mass composition, with 53% of the mass attributed to the larger particle and 47% attributed to the smaller particle. So when reporting DLS results for this sample, the intensity distribution would be used to report the size of particle family, while the mass distribution would be used for reporting the relative amounts of each population.
|
The measured data in a DLS experiment is the correlation curve, the decay rate of which is proportional to the particle diffusion coefficient (D). The hydrodynamic radius (RH) is calculated from the diffusion coefficient using the Stokes-Einstein equation, where k is the Boltzmann constant, T is the temperature, η is the medium viscosity, and f = 6πηRH is the frictional coefficient for a hard sphere in a viscous medium.

|
By definition then, the DLS-measured hydrodynamic radius is the radius of a hypothetical hard sphere that diffuses with the same speed as the particle under examination. This definition is somewhat problematic with regard to visualization, however, since hypothetical hard spheres are non-existent. In practice, macromolecules in solution are non-spherical, dynamic (tumbling), and solvated. As such, the radius calculated from the diffusional properties of the particle is indicative of the apparent size of the dynamic hydrated/solvated particle. Hence the term hydrodynamic.
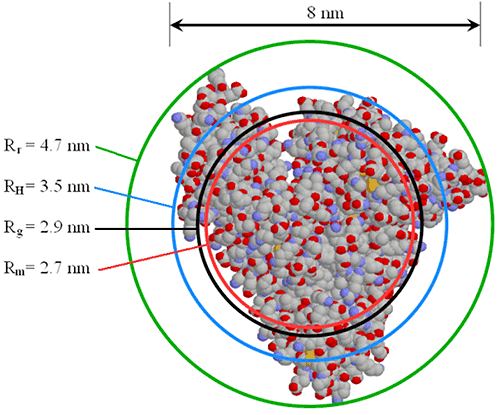
The size of the hydrodynamic radius, relative to other radii values, is very much dependent upon the shape and density of the particle. Figure 23 shows a comparison of various radii values for serum albumin, where Rr is the radius of rotation about the center of mass, RH is the DLS-measured hydrodynamic radius, Rg is the small angle X-ray scattering (SAXS) measured radius of gyration, and Rm is the equivalent spherical radius of a particle of equal mass and density.
|
It is instructive to note, that Rm is the hypothetical radius for a hard sphere with the same mass and density as the protein. One might expect then, to see a closer correlation between Rm and RH. Remember, however, that RH is the hydrodynamic radius, which includes both solvent (hydro) and shape (dynamic) effects. With that said, comparison of the different radii values can yield information about the shape or conformation of the protein.
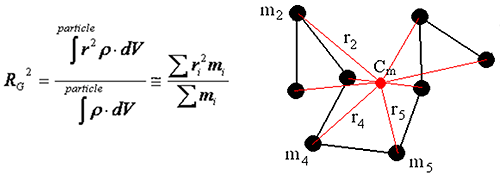
The radius of gyration is defined as the mass average distance from the center of mass to every atom in the molecular, and can be calculated using the equation below, where ρ is the density, r is the distance from the center of mass to the volume or mass element, and the integration is over the total volume of the scattering particle.
|
For larger particles exhibiting anisotropic scattering, the radius of gyration is often measured using angle-dependent static light scattering. For smaller particles exhibiting angle-independent Rayleigh scattering, e.g. proteins and small biopolymers, SAXS is the generally preferred method for radius of gyration measurements.
As noted earlier, differences between the various radii shown here can be attributed to a number of different parameters, shape being one of them. In fact, these differences, particularly the Rg/RH ratio, can provide insight into the structure of proteins and biopolymers. The theoretical values for the shape-dependent Rg/RH ratio are listed in the table below. (see W. Burchard in "Laser Light Scattering in Biochemistry", ed. S.E. Harding, D.B. Sattelle, and V.A. Bloomfield, Royal Society of Chemistry Publ., 1992, 3-22).
| Architecture | Rg / RH |
|---|---|
| Homogenous Spheres | 0.77 |
| Random coil, monodisperse | 1.5 - 1.8 |
| Random coil, polydisperse | 1.7 - 2.1 |
| Regular stars | 1.3 - 1.1 |
| Rigid rod, monodisperse | > 2.0 |
| Rigid rod, polydisperse | > 2.0 |
There are a variety of methods available to researchers for measuring or estimating the molecular weight of macromolecules, including size exclusion chromatography (SEC), gel electrophoresis (SDS-PAGE), analytical ultracentrifugation (AUC), mass spectroscopy (MS), static light scattering (SLS), and dynamic light scattering (DLS). Under the category of "absolute molecular weight", AUC, MS, and SLS are the only techniques listed above that will give an absolute measurement, i.e. in the absence of calibration standards. SEC, SDS-PAGE, and DLS will only give molecular weight estimates, by comparison of a measured property to the same property measured for a series of standards of assumed similarity.
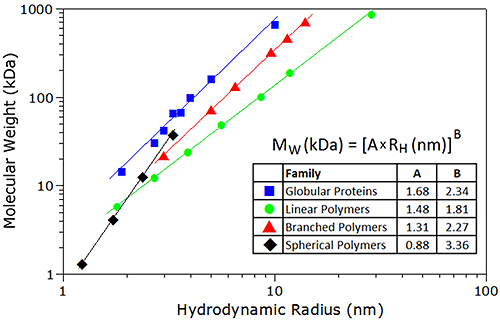
When estimating the molecular weight of a macromolecule from a DLS measurement, an approach similar to that used in SEC can be applied. With historical SEC, a molecular weight vs. elution time or migration distance calibration curve is used; with DLS, a molecular weight vs. hydrodynamic size calibration curve is used.
As with SEC techniques, the correlation between the specific volume of a particle and its tertiary conformation complicates the development of a universal calibration curve for DLS. However, empirical mass vs. size calibration curves, each particular to a specific family or type of macromolecule, are available for use in DLS applications - assuming of course, that a priori information regarding molecular conformation is known. Example calibration curves used for estimating molecular weight from DLS data are shown in Figure 26. For reference purposes, it is noted that all of the proteins in the protein family are globular; the linear polymers are pullulans or linear polysaccharides, the branched polymers are ficolls or densely-branched polysaccharides, and the spherical polymers are starburst-type dendrimers, described as spherical, with a density that increases with radial distance from the core; with all samples measured in 100 mM NaCl.
|
Malvern Instruments' Bioscience Development Initiative was established to accelerate innovation, development, and the promotion of novel technologies, products, and capabilities to address unmet measurement needs in the biosciences markets.