
DSC is an established analytcal tool used during process development and manufacturing of biopharmaceuticals. Rank ordering of thermal transition midpoints (TMs) and other parameters from DSC is commonly used to screen process conditions like buffers, pH and ionic strength. The typical correlation is the higher the TM, the more stable the protein is and less likely to aggregate. DSC is also used as a comparability assay to make sure different lots of the the same protein drug are "highly similar" in thermal stability.
The stability of a biopharmaceutical protein is critical to the success or the failure of the development of a viable drug. Protein stability is important for production, manufacturing, formulation, long term storage, delivery to patient, and efficacy. Highly stable proteins will likely have fewer issues with the manufacturing process, would be more cost-effective to produce, and will have a better chance to remain functional during formulation and storage without chemical alteration or aggregation. In the “Quality by Design” (QbD) approach for biopharmaceutical development, stability characterization is part of the assessment of the “developability” or “drugability” of any potential drug candidate, as well as during process development and manufacturing. Stability data is also incorporated in higher order structure (HOS) characterization and “fingerprinting” used for manufacturing support, biopharmaceutical comparability and biosimilarity. Protein HOS characterization is also becoming expected in regulatory submissions for new biopharmaceutical drugs and biosimilars.
Due to the complex nature of proteins, biophysical tools are important in the complete characterization of a biopharmaceutical product. There are several biophysical tools used to assess protein stability, including and not limited to circular dichroism (CD), dynamic and static light scattering (DLS and SLS), size exclusion chromatography–multi-angle light scattering (SEC-MALS), Fourier transform infrared spectroscopy (FTIR), analytical ultrafiltration (AUC), size exclusion chromatography (SEC), differential scanning fluorescence (DSF), intrinsic fluorescence (IF) and differential scanning calorimetry (DSC).
While all of these biophysical assays play an important role in biopharmaceutical development, characterizing thermal stability by DSC is critical. In a 2015 article about biophysical techniques for monoclonal antibody higher order structure characterization, Gokarn et al. stated: "DSC remains as an unparalleled technique to assess the thermodynamic stability of proteins in a given buffer condition”[1].
The focus of this white paper is how DSC is used to characterize the thermal stability of protein biopharmaceuticals (primarily antibodies) during process development and manufacturing, to choose the solution conditions the protein is preferentially in its native, folded conformation, so the protein remains stable and soluble throughout purification and manufacturing until final formulation, fill and finish.
DSC is a microcalorimetry technique that is used to characterize the thermal and conformational stability of proteins, nucleic acids, lipids, and other biopolymers[2-7]. DSC measures heat capacity as a function of temperature. The DSC instruments used for protein characterization described in this white paper are “power compensation” instruments, with the biopolymer in solution, placed in a fixed-in-place sample cell, and a matched reference cell filled with buffer. The heat capacity (Cp) signal from a sample cell is compared with a reference cell. As the temperature of the cells is increased, the temperature differences between the reference and sample cells are continuously measured and calibrated to power units. DSC is a "forced degradation" assay, as the protein is exposed to increasing temperature, the protein begins to unfold, and the Cp of the protein increases (Figure 1).
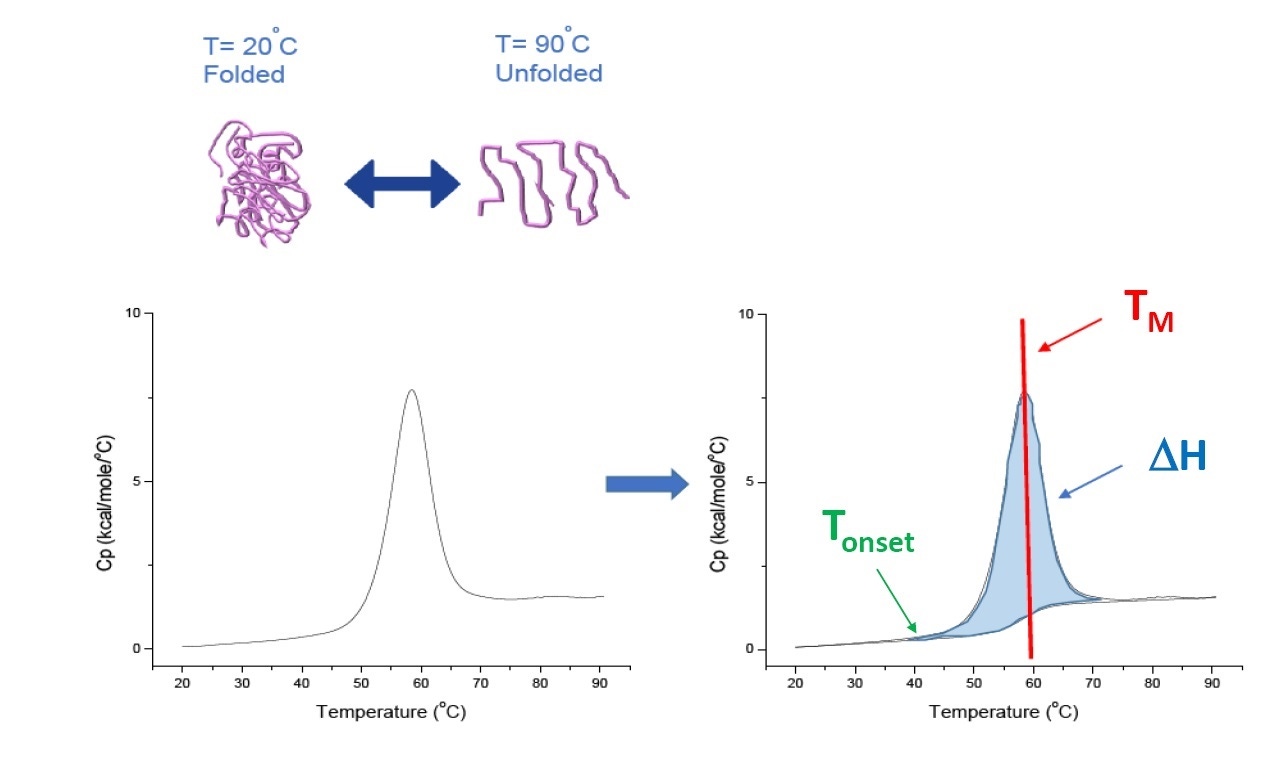
Figure 1. How DSC works.The heat capacity (Cp) changes as a protein thermally denatures. The DSC experiments starts at a temperature where the protein is primarily folded in its native conformation. With increasing temperature, at some point the protein will begin to unfold/denature (Tonset) and the Cp increases. At the temperature where 50% of the protein is in its native conformation, and 50% is denatured, the Cpwill reach its maximum value, this is the thermal transition midpoint or TM. Above the TM the protein will be primarily denatured, and at the end of the DSC experiment all of the protein is in its unfolded conformation. Experimental parameters for DSC include Tonset, TM, and the unfolding enthalpy (ΔH).
DSC directly measures the heat capacity change, without need for any fluorescence or other label or probe. For a protein which reversibly denatures, the thermal transition midpoint (the TM) also called the melting or denaturation temperature, is the temperature where 50% of the protein is in its native (folded) conformation, and 50% is in its denatured conformation. The TM is seen as the “peak” of a DSC thermogram.
TM is considered a good indication of thermal stability – the higher the TM, the more thermally stable the protein is. Multi-domain proteins (like antibodies) typically have more than one peak on a DSC thermogram, so more than one TM can be determined (see Figure 2 for an example).
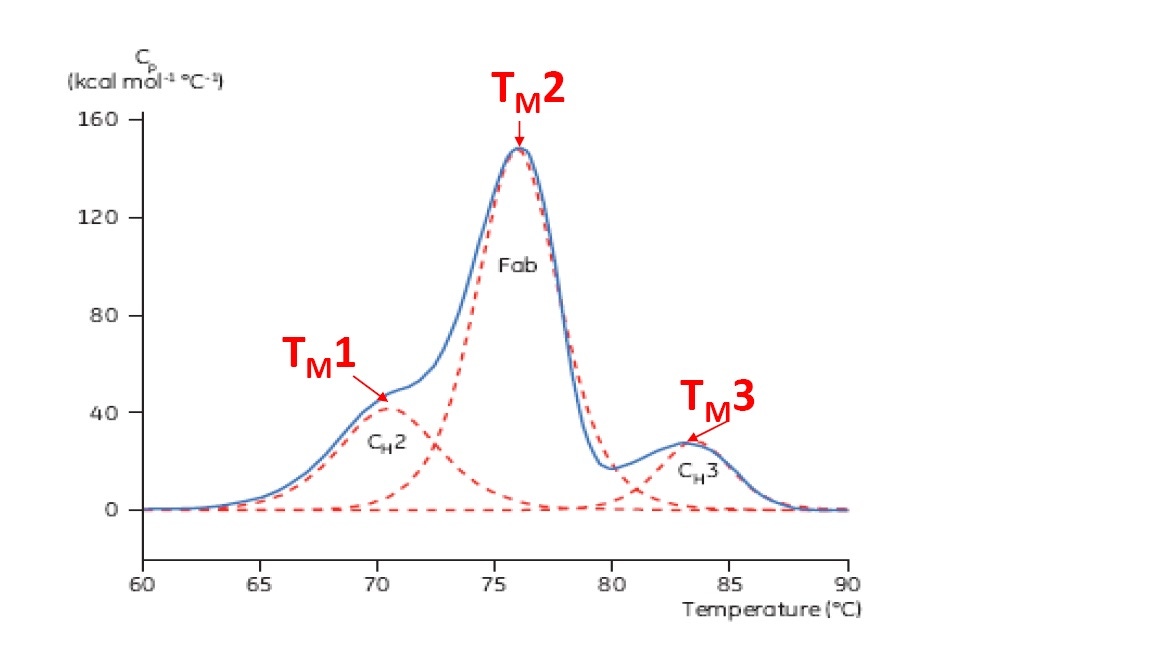
Figure 2. Representative DSC thermogram of a monoclonal antibody, with CH2, Fab, and CH3 domains identified. The dashed red lines are the deconvoluted peaks of each domain transition, with the three TMs indicated.
DSC provides other useful parameters which can be used to characterize and rank order protein stability, including the unfolding enthalpy (ΔH) which is measured by the area under the curve. Protein unfolding is endothermic, since energy input is needed to break the secondary non-covalent bonds that keep the protein folded. DSC also determines the Tonset (start of unfolding), ΔCp (heat capacity change of unfolding), and T1/2 (width at 1/2 the peak height, indicative of the shape of the unfolding thermogram). DSC analysis can include the determination of any combination of these parameters.
Most proteins are irreversibly denatured, and tend to aggregate or precipitate after thermal denaturation. The TM and other parameters from the DSC analysis of irreversibly denatured proteins are not true thermodynamic parameters. However, the rank ordering of TM from the DSC of an irreversible protein denaturation is very useful for qualitative parameter stability screening.
Malvern Instruments offers the MicroCal VP-Capillary DSC system[8,9] which is an automated DSC designed for TM screening and thermodynamic characterization of proteins and biopolymers in solution.
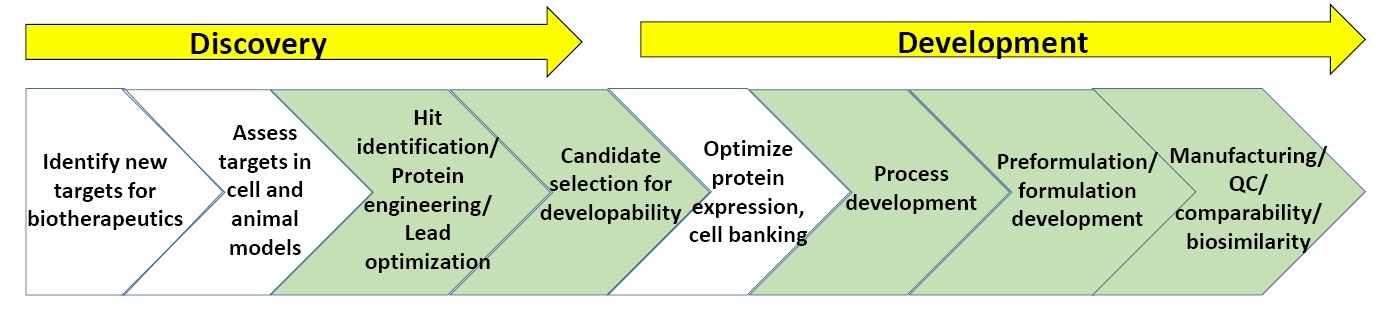
Figure 3. General scheme of processes in biopharmaceutical discovery and development.
Figure 3 shows a general scheme of biopharmaceutical discovery and development. The sections in green are where biophysical characterization, including stability assays, are most commonly utilized. (At the end of the white paper is a list of “Suggested Reading” on biopharmaceutical discovery and development).
The sequence of amino acids, or primary (1°) structure, is the most basic component of the polypeptide chain and protein structure. It is important to understand and characterize the protein’s three-dimensional structure, also called higher order structure (HOS). There are three levels for protein HOS: secondary (2°), referring to the local folding patterns of a protein’s primary structure, including α-helix, β-sheet, turns, and random coils; tertiary (3°), the final 3D structure of a protein, arising from array of secondary structural elements; quaternary (4°) which are structures that involve the interaction of two or more identical or different polypeptide chains.
For a desirable biopharmaceutical, scientists initially look for biomolecules that already demonstrate high stability during candidate selection, and may need to design increased stability via protein engineering. During purification, the protein is removed from the conditions where it is stable, correctly folded, and active, and it is important to use the buffers, additives, purification, and storage conditions to keep to protein as stable as possible throughout the process.
When the protein molecules are exposed to stresses like heat, chemicals, pH changes, pressure, mixing, and high concentration, which frequently occur during biopharmaceutical production and formulation, the protein conformation can favor the denatured (unfolded) protein. Formulated subcutaneous (SC) protein drugs must be stable and unaffected at very high protein concentrations (over 100 mg/ml) within its container closure, (e.g., vial or prefilled syringe) for several years. Proteins in solution are also susceptible to modifications like deamidation and oxidation, that will also lead to denatured, inactive proteins.
In the case of a protein biopharmaceutical, denaturation and other modifications could result in the formation of aggregates that have reduced efficacy or are nonfunctional as a drug. More significantly, protein aggregation can result in a potentially fatal immunogenic response in a patient. Using a stable protein drug will lead to more cost-effective production, and a successful and effective drug product.
DSC is a measure of the conformational stability and changes in tertiary and quaternary structure when a protein is thermally denatured, as well as how intrinsic and extrinsic factors affect protein stability. DSC is considered the best and most quantitative assays for thermal stability used in characterization of biopharmaceutical proteins, as a predictor of long-term stability[1,10-14]. TM from DSC is a frequently-used parameter, to rank-order stability in candidate selection (developability), formulations screening, and process development. More stable proteins have a higher TM. Enthalpy (ΔH), Tonset, T1/2, and ΔCp from DSC are also used in rank-ordering stability, validation of DSC data, quantitative analysis of protein unfolding, and higher order structure “fingerprinting”[10-14].
DSC analysis for a protein in a defined solution condition is reproducible and quantitative if the protein is the same or highly similar (Figure 4). That is the DSC thermograms will have a reproducible pattern, and parameters (including TM, ΔH and Tonset) will be within an accepted range[12-14]. If the thermograms are different and the DSC fit parameters change, this suggests there is a protein misfolding, degradation, aggregation, differences in solvent, changes in posttranslational modification, or other higher order structure differences causing changes in conformational stability.
Reproducible and quantitative data makes DSC a valuable tool in comparability and HOS analysis for product evaluation during manufacturing (including batch-to-batch and site-to-site comparability), comparison of protein variants and modified products (including structural changes due to glycosylation and oxidation), and biosimilarity. DSC data are also used in regulatory support documents as a HOS characterization for new drug and biosimilar submissions. In a survey of scientists in the biopharmaceutical industry, DSC was ranked as a "very useful" to "extremely useful" HOS biophysical tool for candidate selection, formulation development, product characterization, comparability, process development, and biosimilarity[15].
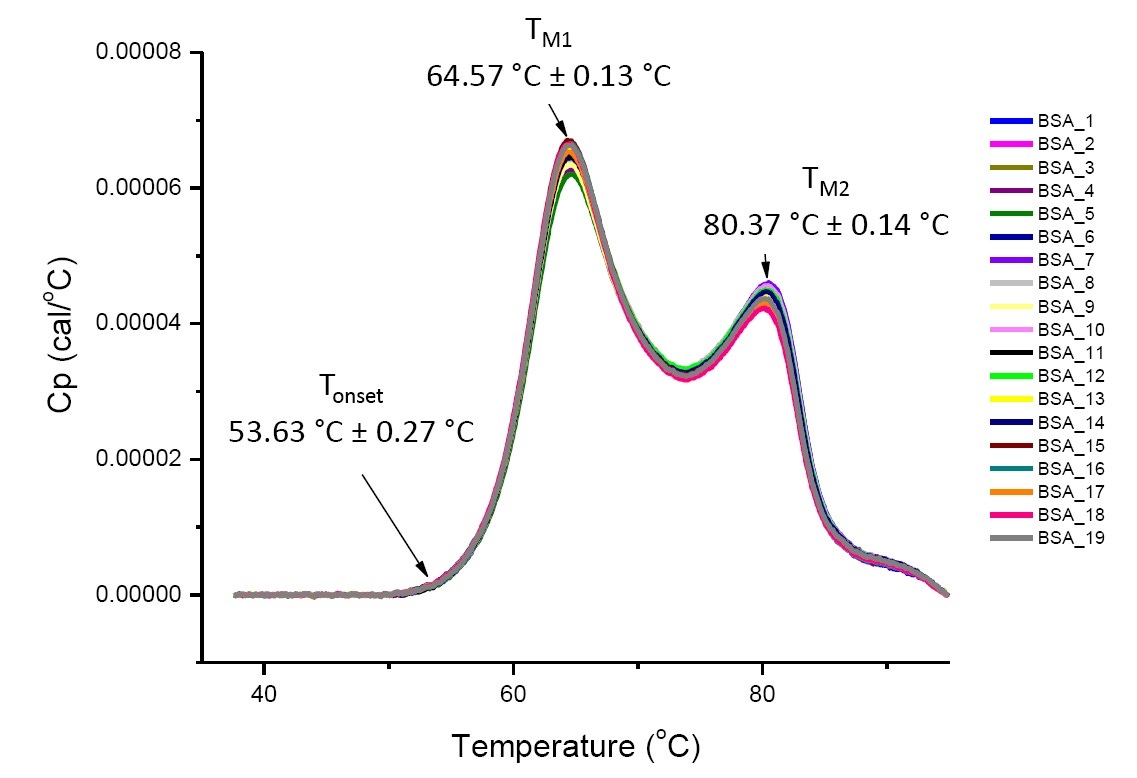
Figure 4. Nineteen DSC thermograms of bovine serum albumin (Sigma A1933, chromatographically purified) in PBS. DSC data shown after scan rate normalization, buffer-buffer subtraction, and integration baseline subtraction. Mean and standard deviations of Tonset, TM1, and TM2 are shown.
For multi-domain proteins like antibodies, DSC thermograms have more than one unfolding transition (Figure 2). DSC is able to characterize and quantitate the different domains, and determine the TMs for two, three or more transitions. The TM values are from the thermogram peak(s) and can be simply determined from the DSC data, without the need for complex data analysis. Other biophysical assays which can determine TM, such as CD, IF and DSF, may only detect the first TM (occurring at the lowest temperature), or the most "dominant" TM for multi-domain proteins. Extraction of more than one TM from spectroscopic and fluorescent data requires complex data fitting and may not be reproducible.
DSC does require more protein sample per scan, and can be lower-throughput, compared to other TM screening assays. If sample is limited, one option would be to perform an initial TM rank ordering with DSF or IF, and choose several samples to validate TM with DSC. It is important to validate the TM results with DSC, and not rely only on fluorescence or spectroscopy for TM in stability assays. Fluorescence-based assays can have artifacts which interfere with the output, and the TM results could be shifted to a higher (or lower) value due to these artifacts. Some proteins and buffer conditions are not compatible with fluorescence, and may not detect TM differences. Finally, fluorescence and spectroscopy do not determine the calorimetric enthalpy, and other thermodynamic parameters like DSC.
DSC is considered by the biopharmaceutical industry as the “gold standard” thermal stability assay because DSC:
Uses heat changes associated with protein unfolding.
Is a direct measurement of protein unfolding, so no label, probe or tag is needed. No potential detection artifacts which can be found in fluorescence or other spectroscopic assays.
Uses native proteins in solution.
Can be used with practically all buffers and additives in common use for biopharmaceutical purification and formulations. Some buffers and additives are not compatible with fluorescence or spectroscopy.
Is easy to use for experimental set-up.
Has high precision temperature control, with temperature range up to 130 °C, so can detect most high TM transitions. Other TM screening assays can heat samples up to 100 °C (or lower).
Is a “forced degradation” assay so does not require storage of protein in buffers prior to DSC. SEC-HPLC and DLS often require incubating samples in buffer at elevated temperature to detect changes in conformation.
Has simple data output and integrated data analysis software.
Can be used to resolve separate unfolding transitions and characterize multidomain proteins and protein complexes, as well as simple single-domainproteins.
Is information rich: get thermodynamic data as well as conformational stability and TM determination.
Can be used as primary assay for biotherapeutic thermal stability characterization, also used with other biophysical screening tools which are orthogonal or complementary, and/or validate other data.
DSC available with high-throughput automation (MicroCal VP-Capillary DSC system) for rapid screening of thermal stability.
Examples of how DSC data are used in biopharmaceutical discovery and development will be found in this white paper, other Malvern white papers and application notes, and cited publications.
Monoclonal antibodies and other biopharmaceutical drugs are complex proteins and need to be produced in mammalian or bacterial cells. Each protein is unique and requires extensive research, characterization and optimization in order to transform the protein into a drug. As part of discovery and early development, the desired properties of the protein drug are defined, including purity, potency, and dosage. Biochemical, biophysical, and biological assays are developed to study these characteristics, and optimized throughout product development.
Detailed protein characterization and HOS (including stability) is carried out for each process to define the critical protein quality attributes and critical process parameters, needed to control and validate processes throughout the entire product life cycle. In the “Quality by Design” (QbD) approach for biopharmaceutical development, critical quality attributes and stability characterization is part of the assessment of the drug during process development and manufacturing support[16,17].
During the process development of a protein drug, the protein is exposed to different conditions, including:
Different solutions, including varying buffer, pH, and salt.
Formulation additives (excipients).
Range of protein concentrations
Repeated freeze/thawing cycles, increased pressure and mixing/agitation
Different material surfaces protein comes in contact with (pumps, ultrafiltration/diafiltration membranes, chromatography media, etc.).
Exposure to oxidants, proteases, cell growth media, product variants, etc.
Any of these conditions can disrupt the forces and interactions that keep a protein in its native folded conformation, resulting in denatured/inactive protein. There can also be chemical denaturation due to oxidation, deamidation, changes in glycosylation or other posttranslational modifications, Understanding the processes and conditions which can lead to more stable protein drugs is important through process development, to optimize each step.
Denatured proteins often result in aggregate formation, which are a key issue for biopharmaceuticals. Aggregation during the purification will result in decreased product yield and increased costs. The presence of aggregates and other particles in the final drug product will present a serious immunogenic risk to the patient.
During process development and manufacturing support, biophysical assays are used to monitor protein stability and aggregation, including but not limited to: DSC, DLS, fluorescence, CD, AUC, SEC, Raman spectroscopy, nanoparticle tracking analysis (NanoSight from Malvern Instruments), resonant mass measurement (Archimedes from Malvern Instruments), and microscopy. Protein bioactivity is also monitored throughout the process, through bioassays, isothermal titration calorimetry (ITC) and surface plasmon resonance (SPR).
Protein stability studies such as DSC during process development and manufacturing support can:
Identify appropriate buffers for process steps, including chromatography and ultrafiltration/diafiltration (UF/DF) to increase stability and minimize degradation.
Identify and optimize hold steps.
Ensure that processing conditions can be effectively controlled.
Help in maximizing yields and reduce costs.
Be used in HOS and comparability characterization.
Stability studies also enable candidate selection to choose a “developable” engineered protein, as well as accelerated development of formulations for the drug product. Choosing the most stable protein, and using optimal conditions during process development and formulations, translates into savings of resources, cost and time, and increased probability of having a successful commercial product.
In biopharmaceutical process development, each step is optimized for protein yield, speed, purity and cost of process. The process should also be able to tolerate minor changes in pH, ionic strength and other conditions, and still produce the desired drug product. Each process step also has to be scale-able. In discovery and early stage development, a small amount of protein is purified (in milligram quantities or more) for in vitro studies and protein characterization. Typically, these quantities can be produced with bench-top protein expression and purification systems. In later stage development and preclinical trials, there must be enough purified protein (grams) to perform necessary animal studies (e.g. toxicology and pharmacokinetics). The proteins are produced with larger-scale “pilot” systems. To manufacture the protein for clinical trials in patients and commercial production, it is critical that there is a robust, reliable, and consistent manufacturing process in place. Managing biomanufacturing capability, capacity, and cost is a critical issue for all biopharmaceutical companies.
Upstream Process Development
Upstream process development refers to the steps associated with the culturing of cells to express the biopharmaceutical protein. Biopharmaceuticals are produced in mammalian or bacterial cells and there are a variety of available protein expression systems. The goal is to identify the cell line and optimize the growth conditions to produce the most protein in a reliable, safe and efficient manner. Upstream process development is based on factors such as the nature of the protein and achieved product yields. Other factors such as costs, intellectual property (IP), in-house experience, and equipment availability are also important.
Scientists begin with the DNA sequence which encodes the protein of interest. They introduce the gene of interest into the host cell using an appropriate protein expression system. At this point in early drug discovery there can be up a “library” with thousands of different cells (clones), and scientists spend several months characterizing the clones, and screening expressed protein for therapeutic value. Protein engineers also identify the clones which have the highest expression level of the desired protein. If there is a cell line that produces more active protein per milliliter compared to other cell lines, the manufacturing costs can be decreased using that clone. They also perform protein engineering to improve protein expression, stability, and other properties making the drug more “developable.”
Once the “best” clone has been designed and selected, cells are grown and then divided into a couple of hundred vials to create cell banks. Cell banks are carefully managed and maintained, rigorously tested to confirm cell line integrity, and are stored in multiple locations. These cell banks are used so that every manufactured lot of protein starts with identical cells.
Scales of upstream process development:
Laboratory scale: 1 ml to 30-liter cell culture, to produce protein for research, initial protein characterization and pre-formulations, process scouting, screening, and optimization.
Pilot scale: 30-liter up to 150-liter cell culture (or more). Produce protein for formulations, protein studies, and pre-clinical trials.
Production/manufacturing: 500 to 20,000, up to 90,000-liter (or more) cell culture. Produce protein for in cleanroom under GXP protocols, for clinical trials and manufacturing of final drug product. During manufacturing, cells are grown for several weeks, depending on the cell line and process. Production-quality cell lines typically produce at least 20 picograms of protein/cell/day, or about 5-10 milligrams of protein per milliliter of cell culture.
Downstream Process Development
After cell culture, the specific protein drug must be isolated from the other host cell proteins and cell culture components, purified and concentrated through a series of separation techniques. Protein therapies typically require concentrated material, a large amount of highly purified product, which is free of contaminating proteins, nucleic acids and viruses. A downstream production process must achieve the required purity and recovery with complete safety and reliability, at the required production scale.
Figure 5 is a typical workflow for an antibody downstream process. Note there are several steps in the process which can adversely affect protein stability (such as pH changes), so protein stability assays like DSC are important tools to validate processes.
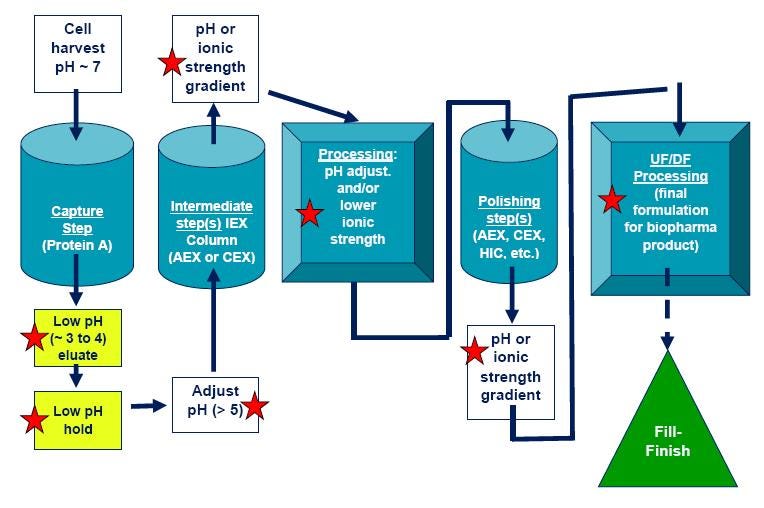
Figure 5. General monoclonal antibody purification process. Steps that could render a protein unstable (and require protein stability assays) are denoted with red stars. CEX = Cation exchange chromatography; IEX = Ion exchange chromatography; AEX = Anion exchange chromatography; HIC = Hydrophobic interaction chromatography.
Methods development in chromatographic purification processes is a complex operation and has traditionally relied on trial and error approaches. Though there are well-established antibody purification methods as detailed in Figure 5, every protein is different so each process needs to be optimized one step at a time.
Cell harvest: If the protein of interest is secreted into the cell culture medium, the cells are removed by centrifugation. The supernatant is then clarified by filtration, to remove any remaining cells. If the protein of interest is still in the cells, the cells are centrifuged and the cell membranes are broken to release the protein.
Chromatographic purification steps: Chromatography involves the use of solid support beads (also called medium, matrix or resin) of agarose, dextran, polyacrylamide or other polymers, with a functional group bound to the beads. The beads are packed in columns ranging from 96 well plate or small spin columns for screening, 1-5 ml for bench top method scouting, to hundreds of liters for production. Chromatography systems also include pumps, bottles/tanks to hold wash and elution buffers, in-line detectors (for buffer pH, ionic strength, UV, etc.), and a way to collect eluted protein. Specific bioprocessing media and equipment is designed for each chromatographic stage and scale. Biophysical protein stability assays are frequently used to evaluate and optimize the buffers and chromatography resins used for protein purification, see the rest of the white paper for examples.
Capture step initially isolates the target protein from harvest, concentrates to reduce sample volume, and make sure protein is quickly stabilized to maintain activity. Protein A affinity chromatography is the most common capture step for monoclonal antibodies. Antibodies bind to Protein A matrix at appropriate buffer, pH (around pH 7), and ionic strength. Antibody is removed (eluted) from the column with a decrease in pH.
Following elution from Protein A chromatography column, there is typically a viral inactivation step (an acidic pH “hold” step and/or filtration) for therapeutic drugs, followed by neutralization to pH above 5. Exposure of the protein to acidic pH for Protein A elution and the viral inactivation step is frequently a protein destabilizing process, and can lead to aggregation.
Intermediate purification step(s) will remove most of the impurities, including contaminating host cell proteins, DNA, and viruses. In this stage, resolution and binding capacity are optimized. This stage uses one or more steps, typically ion exchange (IEX), hydrophobic interaction chromatography (HIC), and/or an affinity chromatography step. Protein stability needs to be maintained. For example, ion exchange chromatography typically involves elution with a high ionic strength buffer, and if the protein is not stable to high salt concentration that can also lead to protein denaturation and aggregation.
Polishing is the final removal of trace amounts of impurities. In this stage resolution and recovery are optimized. One (or more) of following chromatographic steps are used: ion exchange (IEX), hydrophobic interaction chromatography (HIC), and/or gel filtration/size exclusion chromatography (GFC/SEC).
Filtration and membrane chromatography are used in process development in addition to or as replacement for chromatography columns. These are used for buffer exchange, concentration, and purification steps. While low pressure filtration is normally not harmful, proteins exposed to high pressure and high concentrations can often denature and aggregate, so these steps need to be carefully monitored.
For each chromatographic step, “scouting” experiments are done to select the optimum resin and binding/elution conditions (buffer, pH, ionic strength, etc.) for that process, using 96-well plates, or small pre-packed columns and a bench-top chromatography system. Initial scouting experiments can optimize protein binding capacity, as well as the flow rates.
The process is then scaled up and run in the pilot plant. This allows assessment of a process for its ability to meet the target specification for purity and product characteristics and to make modifications as necessary before transferring the process to manufacturing. The product produced at this stage is often used for pre-clinical studies. During this period will be pre-formulation/formulation development of the biopharmaceutical, to optimize the drug formulation used for the final product.
Finally, the process is transferred into the large-scale manufacturing facility. Biopharmaceutical manufacturing requires continual refinement and optimization throughout process development, clinical trials, and marketing after product approval. Reasons to alter manufacturing procedures include:
Improvement of product quality
Increased yield from cell growth and/or purification
Improved manufacturing ability
Cost reductions/improved efficiency
Incorporate new technologies or intellectual property (IP)
New formulations or drug delivery methods
Drugs, including biopharmaceuticals, are manufactured following GMP (Good Manufacturing Processes). GMP ensures that products meet specific requirements for identity, quality, function and purity, and safety. There are regulations which need to be followed, some are specific for biological, other are more generic, for example 21 CFR part 11, which are regulations involving electronic records and electronic signatures for data and other documentation.
Regulatory agencies also have guidelines which are meant to be used in manufacturing, including:
Stability testing
Process validation
Process analytical technologies
Bioanalytical method validation
Comparability of biopharmaceutical products.
Quality by Design
Comparability and biosimilarity of biopharmaceuticals
It is important to demonstrate that the manufactured protein is comparable in structure, stability, size distribution, and biochemical and functional assays to:
The same protein manufactured in previous lots and reference protein
The same protein manufactured at different sites of the same company
The same protein manufactured by a modified upstream or downstream process
Scale up of upstream or downstream process
The same protein in a different formulation
Manufacturing changes should have no negative impact on product quality. Biochemical, biophysical and functional assays for comparability (or biocomparability) are designed to demonstrate that the manufactured protein product is “highly similar” in the designated quality attributes, compared to a reference. No single analytical method can be used for comparability of protein drugs. Comparability is a major concern for protein therapeutics, and is addressed by several international regulatory agencies.
It is important to note that testing and establishing comparability during a manufacturing process (or change) is not the same as the testing during development of a biosimilar drug product - developing a biosimilar is far more complex process. Since a biosimilar product is not by the same company that developed the innovator (or parent or reference product), biosimilar development requires “reverse engineering” to establish new upstream and downstream processes. The biosimilar manufacturer has to match product quality (biosimilarity) within the narrow range of the innovator’s commercial product, requiring more biophysical and biochemical evidence to demonstrate biosimilarity than what is typically needed to show comparability during manufacturing.
Since DSC provides information on the thermal stability of a protein under different solvent conditions, and DSC results are reproducible, DSC is often included in comparability studies to show that the process does not result in change of product stability, and that the manufactured product from different lots and sites are highly similar. DSC is also commonly used as a biophysical assay to show that a biosimilar has a highly similar DSC profile, compared to the innovator product.
It is important for a biopharmaceutical protein to maintain its stability throughout production and storage until final delivery to a patient. Many proteins have a propensity to aggregate and precipitate — due to intrinsic stability factors plus handling and processing steps — which leads to a significant loss in profit for the biopharmaceutical company, as well as a serious risk to the patient.
The thermal transition midpoint (TM) of a biopharmaceutical protein has been shown to be an exceptionally good indicator of the relative protein stability in solution. DSC allows for the accurate, rapid, and easy measurement of TM, as discussed above[1-15]. In addition, DSC is used to prescreen for the appropriate bioprocessing conditions for maintaining the stability of a biopharmaceutical during manufacturing.
In a Malvern application note from Fujifilm Diosynth Biotechnologies, DSC results were used to optimize the binding and elution of a particular antibody to Protein A chromatography media[18]. As discussed above, Protein A affinity chromatography is commonly used as the initial capture step for monoclonal antibody purification. Due to the binding specificity and selectivity Protein A has for the Fc region of antibodies, this process can often result in nearly pure product in a single step.
The antibodies bind to the immobilized protein A at a neutral pH (around pH 7) and are eluted with a low pH buffer (for example, citrate buffer at pH 3.5). The eluted antibodies are neutralized with a solution having a high buffering capacity such as 1 M Tris pH 9, or via a desalting column. One issue with Protein A affinity chromatography is that antibodies are often unstable at the low pH required for elution. This can result in protein precipitating in the column during or after elution, resulting in poor protein yield and more expensive processing costs. Precipitation is usually dependent on protein concentration, and high concentration favors aggregation and precipitation. Most commercially available Protein A chromatography media can bind at least 20 g of antibody per liter of medium, however reduced protein stability at low pH, post-elution, becomes the limiting factor for the loading of the column. Although many antibodies are pH-sensitive, the mechanism of denaturation and aggregation varies with structure and will require different buffers for optimal stability.
To improve the loading capacity and economics of the Protein A chromatography process, the protein needs to be stabilized in the elution buffer. DSC can be used to characterize the stability of the antibody as a function of pH, and quickly determine which additives can improve the protein stability at low pH. The protein A chromatography step can be made more economically viable by stabilizing the antibody in the low pH elution buffer, thus increasing the loading capacity.
In a case study described in this application note, process information indicated that the initial binding capacity of Antibody X was limited to 2 g of antibody per liter of Protein A medium[18]. If binding capacity was increased, the antibody precipitated on the column during low pH elution. To understand the effect of pH on Antibody X stability, the protein was prepared in four different buffers: citrate buffer adjusted with Tris to pH 7.0; phosphate buffer pH 7.3; citrate buffer pH 3.5; and citrate buffer pH 5.0. From MicroCal DSC data, Antibody X at pH 7.0 and 7.3 showed a higher TM than antibody at pH 3.5, indicating that the protein was more stable at a higher pH. The unfolding onset temperatures (Tonset) were also higher for pH 7.0 and 7.3 compared to pH 3.5. Antibody X at pH 5.0 had a TM comparable to pH 7.0, and the Tonset was lower, suggesting that pH plays a major role in determining unfolding of this antibody[18].
Antibody X was then prepared in low pH buffers with different additives to determine if any of these conditions could stabilize the antibody at low pH. DSC experiments showed that Antibody X, had the largest positive TM shift (as well as an increase in Tonset) when the protein was in citrate plus mannitol at pH 3.5, compared to citrate buffer pH 3.5. The DSC results suggested that the addition of mannitol to the elution buffer for the Protein A affinity column would improve the stability of antibody X.
Use of citrate plus mannitol as the Protein A elution buffer resulted in at least a 7.5-fold increase in binding capacity to ≥15 g of Antibody X per liter of Protein A medium, as compared to 2 g per liter with citrate buffer only. Since less Protein A medium is needed, and the process is faster, the increased binding capacity directly translates to savings of both money and time, making the process more efficient and cost-effective. Additionally, Antibody X after the Protein A capture step was more concentrated than it was in the earlier process, eliminating an ultrafiltration/diafiltration step, resulting in added savings in materials and processing time[18].
A second Malvern application note from FujiFilm Diosynth Biotechnologies discusses the optimization of the low-pH viral inactivation step used in biopharmaceutical production[19]. This hold step is typically performed while the protein is already in the acidic elution buffer for Protein A chromatography. The low pH hold step for viral inactivation is desirable for protein manufacturing, provided it does not cause any decrease in protein stability. The protein’s exposure to the stress of acidic pH can often result in protein denaturation and aggregation, as discussed above.
The thermal stability data obtained from MicroCal VP-Capillary DSC to characterize the stability of an antibody was used to optimize the low pH viral inactivation for the manufacturing process. For this case study, citrate buffer at pH 3 is a candidate for use for both the elution of the antibody from the Protein A affinity column and for the subsequent low-pH hold step for viral inactivation[19]. Since the majority of proteins tend to become unstable under prolonged exposure to such a low pH, the pH must be raised immediately after the viral inactivation step via neutralization with a basic (high pH) buffer, or via buffer exchange. The DSC scans of Antibody Y in buffer at neutral pH and at pH 3 are shown in Figures 6 and 7.
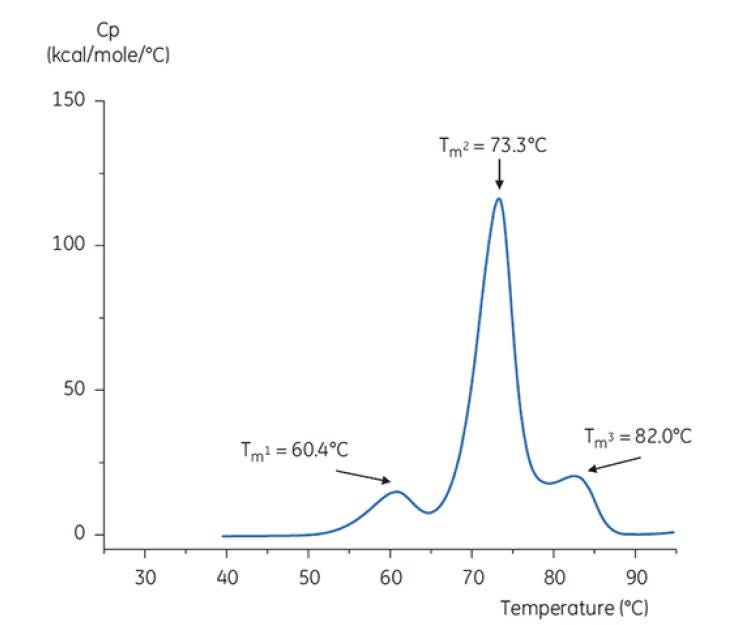
Figure 6: DSC thermogram of antibody Y in reference buffer (Tris, NaCl, EDTA, pH7.4). The DSC thermogram shows three thermal transitions. This kind of thermogram pattern is common for antibodies[19].
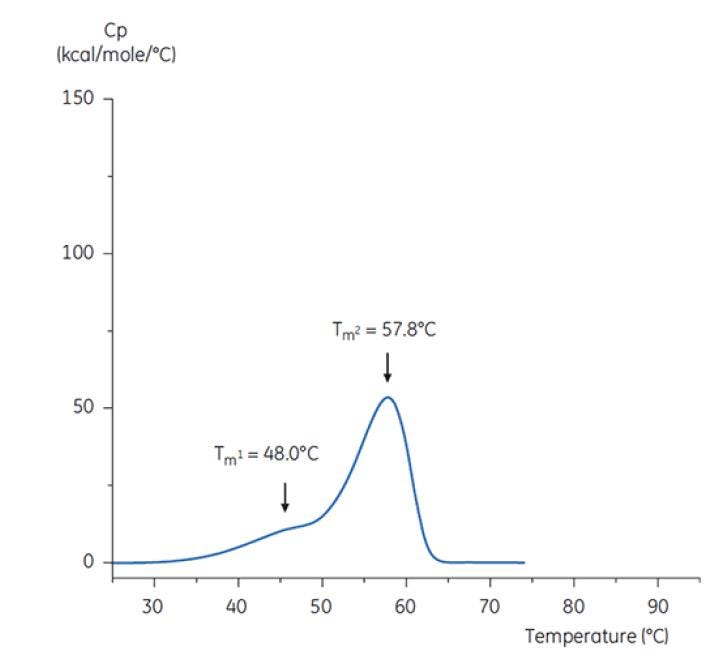
Figure 7: DSC thermogram of antibody Y in low pH hold buffer (citrate, pH 3.0). The DSC thermogram for antibody in pH 3.0 shows a loss of thermal stability (compared to thermogram in Figure 6) due to decreased TM values: TM1 decreased from 60.4°C to 48.0°C, TM2 decreased from 73.3°C to 57.8°C, and TM3 was no longer apparent in antibody in the pH 3.0 buffer[19].
The differences in shape and pattern of the two thermograms in Figures 6 and 7 demonstrate loss of thermal stability of Antibody Y in the pH 3.0 buffer. The peak height of the TM2 transition is lower, the peak is broader and the definition between the first and second transitions in pH 3.0 is less pronounced as compared to pH 7.4[19].
To imitate the pH neutralization step, the pH of the antibody solution was adjusted to pH 6.0 with a concentrated Tris solution at pH 9. The thermogram of the resulting Antibody Y solution is shown in Figure 8. Here, an increased thermal stability relative to the Antibody Y in pH 3.0 buffer is seen. The TM2 and TM3 of Antibody Y in the pH 6.0 solution are similar to TM2 and TM3 of the antibody in the reference buffer (Figure 6). The overall shape, peak definition, and peak width for Antibody Y in pH 6 are also similar to the reference situation at pH 7.4[19].
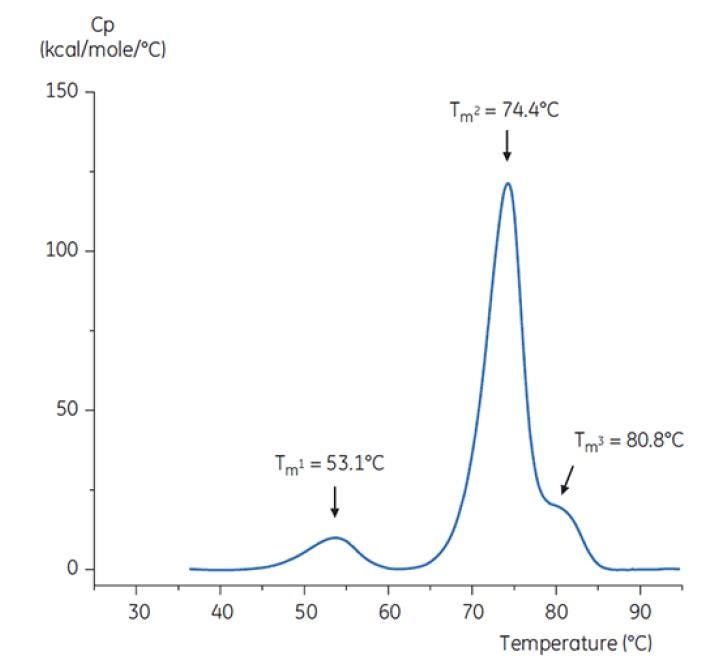
Figure 8: DSC thermogram of antibody Y after adjustment from pH 3.0 to pH 6.0 with 2 M Tris, pH 9.0[19].
The effects of the acidic pH hold step, and subsequent neutralization, on the protein stability has been studied and optimized using DSC by other scientists (for example see reference 20).
Jiang and Nahri[21] reviewed several biophysical techniques for comparability during process development and manufacturing. They cited the use of DSC for as one of the biophysical characterization tools used in comparability of a monoclonal antibody drug product produced using two cell lines (cell line 1 and cell line 2) used for protein expression, as well as a change in the process (processes 2pA and 2pB). The three resulting protein products were assessed by FTIR (to determine the secondary structure), near UV CD and intrinsic fluorescence (compare the tertiary structure) fluorescence and ANS binding (compare the surface hydrophobicity), DSC (compare the thermal stability and solubility), and DLS (compare the hydrodynamic properties and size distribution of the proteins). The results from these biophysical results suggest that the overall secondary and tertiary structures of the three samples were similar. The DSC results indicated that the thermal stability of the protein from cell line 2pB has increased significantly compared to both the 2pA sample and the cell line 1 sample. The 2pA and cell line 1 samples also appear more heterogeneous from DSC; normally 2 to 3 transitions are seen for antibodies (see Figures 2, 6, 7 and 8 for examples of "typical" antibody DSC thermograms). The presence of more overlapped thermal transitions from the DSC of these samples indicated sample heterogeneity. The DSC results suggest that the process change improved the homogeneity and stability of the monoclonal antibody of interest. Based on the biophysical, biochemical, and functional assay comparability data discussed in the article, cell line 2 using process 2pB was deemed to be the better process with more stable protein[21].
A second example from Jiang and Nahri[21] uses DSC to look at comparability of a protein product produced at different manufacturing sites. For this case study Protein Y is comprised of two monomeric polypeptide chains, which are disulfide linked through the Fc region of the molecule. During the course of its development Protein Y was manufactured at different sites. To verify that the protein in these different lots were comparable in native conformation, secondary and tertiary structures, thermal stability, and size distribution, four different samples of Protein Y, representing three samples manufactured at different sites, and the reference protein standard, were analyzed by FTIR, far UV CD, near UV CD, fluorescence, DSC, and AUC.
The DSC scans of the reference standard and 3 samples from different sites have two thermal transitions observed for each sample, and all four DSC profiles are identical within experimental variability. This suggests that there is no difference in thermal stability of the protein among these samples, and that these samples are all folded into the native conformation. The combined biophysical characterization results, including DSC, demonstrated that all four Protein Y samples were comparable, have the appropriate secondary and tertiary structure, and are homogeneous[21].
The production and purification of human IgG, for diagnostic or therapeutic applications is now routine. In the past 15 years IgE-based therapeutics have also gained interest, since IgE is important for host defense against parasites and for protective inflammation, and IgE-mediated signaling through its receptors plays a role in point of inflammatory allergic disease. The constant region of IgE is a homodimer containing duplicate pairs of three unique Ig-fold domains (Cε2, Cε3, and Cε4), and is responsible for binding its two receptors, FcεRI and CD23, also known as FcεRII. Demarest et al. investigated the utility of DSC to for biopharmaceutical process development of IgE, including purification and formulations[22]. DSC enables the investigation of protein stability at the level of individual domains within multi-domain proteins, which is more difficult to do with assays like CD.
The tolerance of Fcε to various pH and salt conditions is important information for determining an appropriate and scalable purification scheme for IgE/Fcε-containing proteins. To study the effect of pH on the secondary structure of Fcε, CD spectra were taken of the protein under buffer conditions ranging from pH 4.5 to 7.4. Between pH 5.2 and 7.4, the spectra of Fcε were identical and contained a single minimum between 216 and 217 nm, indicative of significant ß-sheet and typical of Ig-domains. At pH 5, the Fcε spectrum shifted in a random coil direction (the minimum shifted towards 200 nm), and at pH 4.5, the spectrum suggests the protein is predominantly random coil [22].
Based on the pH-dependent unfolding, the authors investigated whether Fcε may have an attenuated stability between pH 7.0 and 4.5. Thermal denaturation of Fcε at various pH values was monitored by far-UV CD. At pH 7.0, there was one transition for the unfolding of all three domains (Cε2-4). A similar transition was observed at pH 6.0, though the apparent TM decreased by 1°C. Thermal unfolding of Fcε at pH 5.2 resulted in a much broader transition that began 6°C lower than at neutral pH. Only at pH 4.8 were two transitions clearly evident[22].
Based on the initial CD results, detailed pH-dependent stability studies were initiated for Fcε using DSC. The unfolding transitions of Fcε were irreversible and scan rate dependent, suggesting that irreversible aggregation affects the apparent TM values of the protein. DSC also showed transitions which were not evident by CD. Fcε in DSC had two independent unfolding transitions at all pH values below 8.0. One of these transitions was destabilized at low pH and high NaCl while the other was not. The domains involved in the pH-sensitive transition were completely unfolded at pH 4.5 as expected based on the structural data obtained using CD, demonstrating how DSC can be important not only for understanding the stability of folded domains, but their folding status as well[22].
The pH-sensitive domains of Fcε were identified as the receptor binding domains (Cε3 and Cε4) by performing DSC experiments with an Fcγ-Cε2 fusion protein. One domain of both Fcγ-Ce2 and Fcε remains stably folded at pH 2.5. It is known that the Fcγ domains are intrinsically unfolded below pH 3.0, so DSC identifies the Cε2 domain of Fcε as the pH insensitive domain. These results were confirmed by limited proteolysis of Fcε at pH 4.5[22].
In high salt, the Cε2 domain of Fcε was slightly more thermostable. Cε2 was especially stabilized at neutral pH and 750 mM NaCl with a TM more than 7°C higher than the TM measured in 15 mM. In contrast, NaCl significantly destabilized the Cε3Cε4 domains between pH 5 and 6. Cε3Cε4 began to unfold at pH 5.0 in low salt. In high salt, the unfolding transition was shifted 0.5 pH units to pH 5.5, precluding the use of cation exchange chromatography as a viable purification step for IgE or Fcε containing proteins.
Knowledge of the pH and ionic strength effects on IgE stability and structure assisted in the design and optimization of chromatographic processes that helped minimize protein denaturation.
Other published examples on the importance of DSC during process development include:
A combined use of DSC, NMR, and cation exchange chromatography helped understand unfolding and aggregation mechanisms of IgG Fc. Fc aggregation under acidic conditions was found to be determined by the CH2 domain stability. The rate and extent of Fc aggregation were shown to be highly dependent on the subclass (IgG2 Fc was less stable than IgG1 Fc), the degree of CH2 glycosylation, and ionic strength[23].
Investigation of the mechanism of protein particle formation during ultrafiltration/diafiltration (UF/DF), finding that agitation drives particle formation by promoting protein-interface adsorption and desorption. Polysorbate 80 (PS80) reduced particle formation in UF/DF. Measurements of conformational stability (by MicroCal VP-Capillary DSC), colloidal stability, and surface tension demonstrated that PS80 protects against particle formation by preventing protein-interface adsorption, and low conductivity improves the colloidal stability of the protein[24].
Developability assessment studies of biopharmaceutical candidates are often designed to identify potential process development problems associated with protein stability. In the case studies described in this article[25], MicroCal VP-Capillary DSC assays were included in protein short-term stability studies at 2–8°C, 25°C and 40°C, freeze-thaw studies, and limited forced degradation studies, to assist in making developability decisions about candidates. The typical outcomes were: 1) no major or unexpected degradation was found, and the study results are used in early identification of degradation pathways and potential critical quality attributes within Quality by Design guidance; 2) identification of specific degradation pathway(s) that do not affect potency of the molecule, and provide guidance for process and formulation development; 3) identification of degradation product(s) and pathways that adversely affect drug potency, resulting in program termination and reallocation of resources.
Results presented in this white paper demonstrate the importance and effectiveness of incorporating DSC as a biophysical stability assay during biopharmaceutical process development and manufacturing support. Using DSC results, along with other biophysical and biochemical assays, biopharmaceutical companies can make informed decisions on the buffers and chromatography media used for protein purification, that will maintain protein stability and reduce denaturation and aggregation during the process. This translates into more cost-effective drug production, and increased likelihood of a successful commercial product. DSC is also a common biophysical assay used in the characterization of protein comparability (each batch of protein is highly similar, and any process changes do not affect the critical protein attributes), as well as in the development of biosimilars.
Analytical Techniques for Biopharmaceutical Development, R. Rodriguez-Diaz, T. Wehr, S. Tuck (eds.), Taylor & Francis, New York USA (2005). Biophysical Characterization of Proteins in Developing Biopharmaceuticals, D.J. Houde, S.A. Berkowitz (eds.), Elsevier, Amsterdam, Netherlands (2015).
Biophysical Methods for Biotherapeutics: Discovery and Development Applications, T.K. Das (ed.) John Wiley & Sons, Hoboken NJ USA (2014).
Biophysics for Therapeutic Protein Development, L.O. Nahri (ed.), Springer New York, USA (2013).
State-of-the-Art and Emerging Technologies for Therapeutic Monoclonal Antibody Characterization Volume 1. Monoclonal Antibody Therapeutics: Structure, Function, and Regulatory Space, J.E. Schiel, D.D. Davis, O.V. Borisov (eds.), ACS Symposium Series Vol 1176 (2014). doi: 10.1021/bk-2014-1176.
State-of-the-Art and Emerging Technologies for Therapeutic Monoclonal Antibody Characterization Volume 2. Biopharmaceutical Characterization: The NISTmAb Case Study, J.E. Schiel, D.D. Davis, O.V. Borisov (eds.), ACS Symposium Series Vol 1201 (2015). doi: 10.1021/bk-2015-1201.
State-of-the-Art and Emerging Technologies for Therapeutic Monoclonal Antibody Characterization Volume 3. Defining the Next Generation of Analytical and Biophysical Techniques, J.E. Schiel, D.D. Davis, O.V. Borisov (eds.), ACS Symposium Series Vol 1202 (2015) DOI: 10.1021/bk-2015-1202.
Gokarn, Y., Agarwal, S., Arthur, K., et al. Biophysical Techniques for Characterizing the Higher Order Structure and Interactions of Monoclonal Antibodies, in: State-of-the-Art and Emerging Technologies for Therapeutic Monoclonal Antibody Characterization Volume 2. Biopharmaceutical Characterization: The NISTmAb Case Study. J.E. Schiel, D.D. Davis, O.V. Borisov (eds.), ACS Symposium Series Vol 1201, American Chemical Society, Washington DC USA, pages 285-327 (2015).
Cooper, A., Nutley, M. A., and Wadood, A. Differential Scanning Calorimetry, in: Protein-Ligand Interactions: Hydrodynamics and Calorimetry, A Practical Approach, S.E. Harding, B.Z. Choudry (eds). Oxford University Press, Oxford UK, pages 287-318 (2001).
Malvern Instruments white paper “Differential Scanning Calorimetry (DSC) Theory and Practice” http://www.malvern.com/en/support/resource-center/Whitepapers/WP140701-dsc-theory-and-practice.aspx.
Bruylants, G., Wouters, J., and Michaux, C.Current Med. Chem. 12, 2011-2020 (2005) doi: 10.2174/0929867054546564.
Jelesarov, I., and Bosshard. H.R. J. Mol. Recognit. 12, 3-18 (1999) doi: 10.1002/ (SICI)1099 1352(199901/02)12:1<3:AID-JMR441>3.0.CO;2-6.
Choi, M.H., and Prenner, E.J. J. Pharm. Bioallied Sci. 3, 39-59 (2011) doi: 10.4103/0975-7406.76463.
Johnson, C.M. Arch. Biochem. Biophys. 531, 100-109 (2013) doi: 10.1016/j.abb.2012.09.008.
Plotnikov, V., Rochalski, A., Brandts, M., Brandts, J.F., Williston, S., Frasca, V., and Lin, L.N. Assay Drug Devel. Technol. 1, 83-90 (2004) doi:10.1089/154065802761001338.
www.malvern.com
Demarest, S.J., and Frasca. V. Differential Scanning Calorimetry in the Biopharmaceutical Sciences, in: Biophysical Characterization of Proteins in Developing Biopharmaceuticals, D.J. Houde, S.A. Berkowitz (eds.), Elsevier, Amsterdam, Netherlands, pages 287-306 (2015).
Remmele, R.L. Microcalorimetric Approaches to Biopharmaceutical Development, in: Analytical Techniques for Biopharmaceutical Development, R. Rodriguez-Diaz, T. Wehr, S. Tuck (eds.), Taylor & Francis, New York USA, pages 327-381 (2005).
Morar-Mitrica, S., Nesta, D., and Crofts, G.BioPharm Asia 2, 46-55 (2013).
Kirkitadze, M., Hu, J., Tang, M., and Carpick, B. Pharm. Bioprocess. 2, 491-498 (2014) doi: 10.4155/PBP.14.27.
Wen, J., Arthur, K., Chemmalil, L., Muzammil, S., Gabrielson, J., and Jiang, Y. J. Pharm. Sci. 101, 955-964 (2012) doi: 10.1002/jps.22820.
Gabrielson, J.P., and Weiss, W.F. J. Pharm. Sci. 104, 1240-1245 (2015) doi: 10.1002/jps24393.
Cooney, B., Jones, S.D., and Levine, H. BioProcess Int. 14(6), 28-35 (2016). http://www.bioprocessintl.com/analytical/upstream-development/quality-by-design-for-monoclonal-antibodies-part-1-establishing-the-foundations-for-process-development/
Cooney, B., Jones, S.D., and Levine, H. BioProcess Int. 14(8), 24-33 (2016). http://www.bioprocessintl.com/2016/quality-design-monoclonal-antibodies-part-2-process-design-space-control-strategies/
Malvern Application Note “Manufacturing biotherapeutics faster using Differential Scanning Calorimetry (DSC) http://www.malvern.com/en/support/resource-center/application-notes/AN140623-dsc-for-rapid-efficient-development-of-biopharmaceutical-processes.aspx
Malvern Application Note “Preformulation and stability studies of biotherapeutics using DSC” http://www.malvern.com/en/support/resource-center/application-notes/AN140620-preformulation-and-stability-studies-of-biotherapeutics-using-dsc.aspx
Malvern Application Note “Using Differential Scanning Calorimetry (DSC) to optimize antibody manufacturing” http://www.malvern.com/en/support/resource-center/application-notes/AN141113DSCAntibodyManu.aspx
Jiang, Y., and Nahri, L.O. J. Am. Pharm. Rev. 9, 34-43 (2006).
Demarest, S.J, Hopp, J., Chung, J. et al. J. Biol. Chem. 281, 30755–30767 (2006) doi: 10.1074/jbc.M605190200.
Latypov, R.F., Hogan, S., Lau, H., Gadgil, H., and Liu, D. J. Biol. Chem. 287, 1381-1396 (2012) doi: 0.1074/jbc.M111.297697.
Callahan, D.J., Stanley, B., and Li, Y. J. Pharm. Sci. 103, 862-869 (2014) doi: 0.1002/jps.23861.
Yang., X., Xu, W., Dukleska, S., et al. mAbs 5, 787-794 (2013) doi: 10.4161/mabs.25269.