Bryan McCulloch, B.Sc., and Rachel Segalman, Ph.D., UC Berkley
Recent work involving the characterization of multi-component polymer samples for applications in the textile, organic electronics, and bio-pharmaceutical industries has driven the development of a PDA (photo-diode array) detector as a diagnostic tool for UV-vis absorbing species. For example, absorption shifts can be used to analyze the electronic communication between conjugated monomer units in delocalized polymers. By combining the PDA detector with GPC (Gel Permeation Chromatography), a correlation between absorption wavelength and molecular weight can be made. This correlation can detail the electronic communication along the polymer backbone.
Traditionally, UV-vis data of conjugated polymers is acquired using batch spectroscopy. This absorption profile is representative of the bulk sample and used to predict the extent of molecular orbital conjugation. Parameters such as backbone structure and conductivity can be correlated using this profile. It is well known that the efficiency of organic electronics is, in part, dependent on the conjugation length. This length can be optimized through chemical modification of the polymer backbone. The molecular weight of the sample can also affect the electronic properties. Until now, understanding the role molecular weight plays in controlling delocalization parameters required the careful stepwise synthesis of short-chain oligomers with monodispersed molecular weights. For most polymerization techniques, this can be an extreme challenge.
In addition to an absorption profile of the batch sample, extinction coefficients can be measured according to Beer's law (Equation 1), to determine the absorption efficiency of the chromophore. Again, this is calculated as a batch integer with a single wavelength reported. Using the PDA, we have set out to plot the extinction coefficient as a function of both molecular weight and wavelength. In order to make this comparison, three key factors must be taken into account. First, the extinction measurement using the GPC-PDA is a relative value. Extinction coefficients are calculated from the RI signal, which is proportional to concentration. Second, it is assumed that the refractive index increment (dn/dc) is constant over the integrated peak area. The last factor requires the polymer to have a distribution of molecular weights. Plots correlating PDA data to molecular weight are only of value if there is a molecular weight distribution. Without it, the data is meaningless. This note presents a new photodiode array detection method for the analysis of electronic delocalization in conjugated polymers.
|
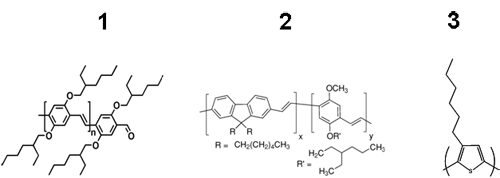
Several examples are presented to demonstrate the diversity of this analytical technique. The chemical structures of the polymers analyzed are shown in Figure 1. Samples were injected twice each at a volume of 100 µL to ensure the repeatability of the data. Chloroform was used as the mobile phase for polymers 1 and 3 and tetrahydrofuran (THF) was used for polymer 2, each with a flow rate of 1 mL min-1. The column and the detectors were held at 30°C for best reproducibility. The molecular weight and polydispersity index for each sample was determined using Viscotek's proprietary column technology, Tetra Detection platform, and OmniSEC software.
|
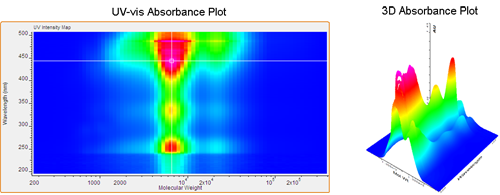
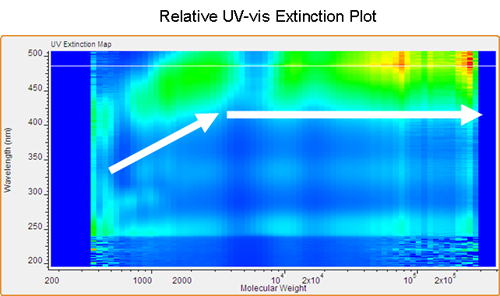
The first example is a standard low molecular weight poly(phenylene-vinylene) (PPV). Figure 2 shows a contour plot produced by Viscotek's OmniSEC software using the GPC-PDA detector. Correlating molecular weight with absorption wavelength provides a detailed view of the polymer's electronic properties. It is evident that the main absorption band for PPV is near 450 nm. The contour plot permits the simultaneous correlation of absorption wavelength and molecular weight. In this example, the maximum absorbance remains consistently at 450 nm over the range of molecular weights. Changing the correlation to reflect the relationship between relative extinction coefficient and molecular weight (Figure 3) adds new insight into the polymer's electronic properties. Comparing this plot to the one seen in Figure 2 reveals the unique information found in the two plots. The extinction (ratio of absorbance to concentration) shows an initial steady increase from low molecular weight to high molecular weight up to 2,000 Daltons. At this point a threshold is reached near 475 nm while the extinction intensity (z-axis) continues to increase, reaching a maximum in the highest molecular weight region.
|
|
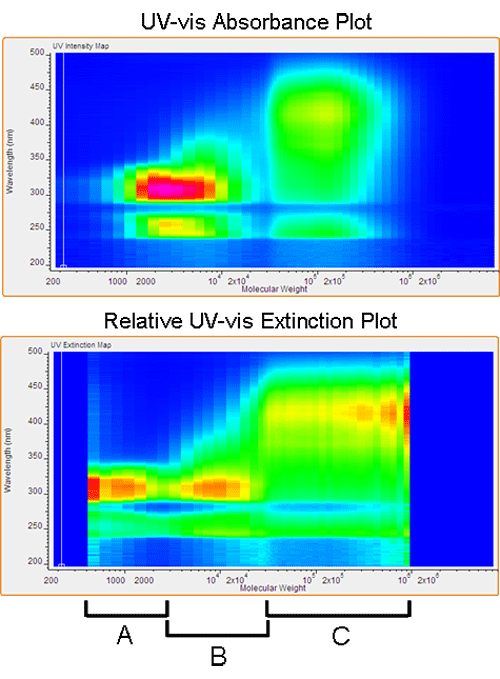
The second polymer studied is poly(fluorene-phenylenevinylene) (PF-PPV). This particular polymer has become a popular option for emitting and conducting layers in OLED and PLED (Organic and Polymeric Light-Emitting Diode) applications. Batch UV-vis characterization of PF-PPV reveals a red-shift in the absorption spectrum with increasing molecular weight. As Figure 4 shows, correlating this shift with molecular weight can identify an optimal molecular weight range for the desired absorption profile. The reaction conditions can then be modified to achieve this range.
|
Figure 4 also shows the relative extinction coefficient plot for this material. It is noted that the extinction coefficient remains constant below a molecular weight of 5,000 Daltons, with a maximum intensity near 300 nm. Between 5,000 and 20,000 Daltons, there is a linear red-shift observed in the maximum extinction value, ultimately reaching a threshold at 425 nm. The extinction plot correlates well with the absorption profile but also shows subtle differences. The maximum extinction intensity is observed at the highest molecular weight, information that is not attainable using batch UV-vis. It is now possible to study the small changes in both absorption intensity and efficiency with respect to molecular weight.
The last example uses polythiophene (PT) to demonstrate the value of comparing both absorption and extinction with molecular weight. Polythiophene is regarded as the benchmark for light absorbing, semiconducting polymers . Figure 5 shows the contour plots for a common PT derivative. It is noted that a shift in the maximum absorbance wavelength is not observed as is it was in the previous examples. The molecular weight distribution is centered at 10,000 Daltons with a maximum absorption intensity at 450 nm. As the molecular weight increases, the maximum absorption wavelength remains at 450 nm. It is apparent that a maximum exciton diffusion length was reached prior to 10,000 Daltons. The relative extinction coefficient plot also shows a uniform maximum intensity at around 450 nm over the entire molecular weight range. This indicates that the absorption efficiency for this PT sample does not vary with molecular weight.
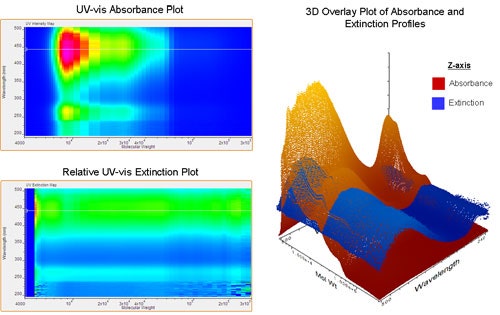
|
The three examples given in this note provide insight into the unique information provided by this GPC-PDA detector. Correlations between absorbance and molecular weight can now be made, creating a detailed picture of the polymer's electronic properties. Efficiency information can also be extracted using the relative extinction coefficient. With this data, exciton diffusion lengths are estimated and absorption properties can be optimized by synthesizing the corresponding molecular weight. Other information such as solvatochromic and thermochromic behavior may be directly correlated to the molecular weight of the polymer.