
In the polymer industry, XRF spectroscopy is a commonly used analytical method to quantitatively determine the concentrations of additives. XRF provides important advantages compared to other more time-consuming or even destructive analytical techniques.
Currently, the European polymer industry needs to determine more than 60 chemical elements in polymer materials, in concentrations ranging from percent to the ppb levels. A variety of inorganic compounds are commonly added to polymers in order to enhance or suppress specific properties.
Currently, the European polymer industry needs to determine more than 60 chemical elements in polymer materials, in concentrations ranging from percent to the ppb levels. A variety of inorganic compounds are commonly added to polymers in order to enhance or suppress specific properties.
Controlling the properties of a polymer helps either during the manufacture of the primary material, during it’s molding into final products or during the lifetime of the product (e.g. catalyst, fire retardant, pigment, anti-oxidant, lubricant, etc.). For example, Mg, Al, Ti and Zn are used as catalysts; Al, P and Zn are used as fire retardants, Ca is used as a lubricant, and Ti and Zn are used as pigments. These additives and fillers are designed to assure the quality of the product and enhance it’s safety for consumers. Therefore, plastics end up being a mixture of compounds that need to be strictly controlled during their production and manufacture.
In the polymer industry, XRF spectroscopy is a commonly used analytical method to quantitatively determine the concentrations of these additives. XRF provides important advantages compared to other more time-consuming or even destructive analytical techniques.
A series of in-house polymer standards (polyethylene and polypropylene) were used to set up the calibrations. In order to shape the polymer samples into disks of 40 mm in diameter, a few granules (typical weight of 2 - 5 g) were hot- pressed between two plates.
By using spacers between the plates, polymer disks of 2 mm in thickness were obtained. To avoid contamination, the polymer samples were cleaned with iso-propanol before measurement.
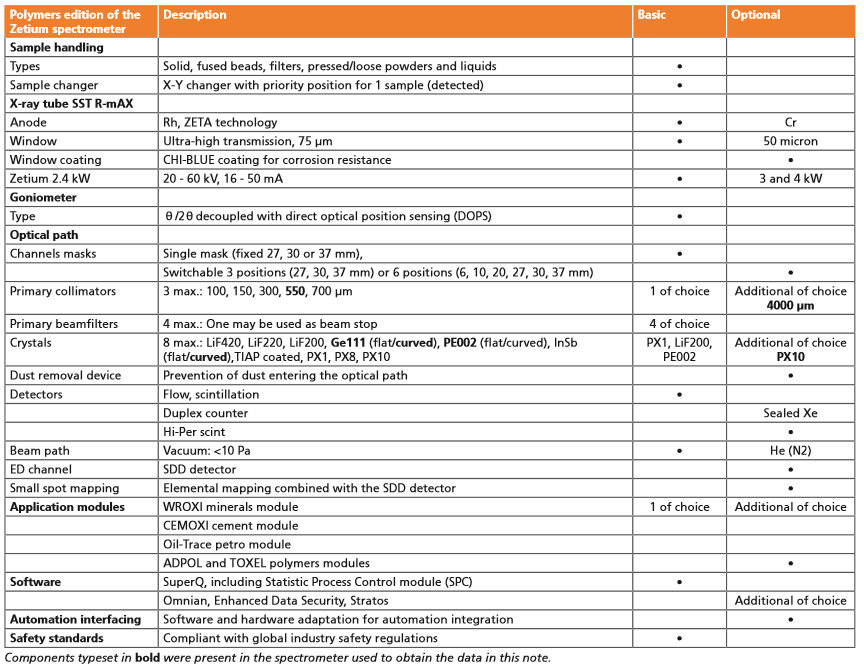
The analytical conditions of the instrument are optimized for the analysis of additives in polymers, as suggested by the software (see Zetium configuration on back page). The wavelength dispersive optics were used of the Polymers edition of the Zetium XRF spectrometer.
For the analysis of Al and P, special curved crystals were used to enhance the sensitivity and spectral resolution. The total measurement times for all elements in the polymer sample are listed in Table 1.
Table 1. Total measurement time (peak + background)

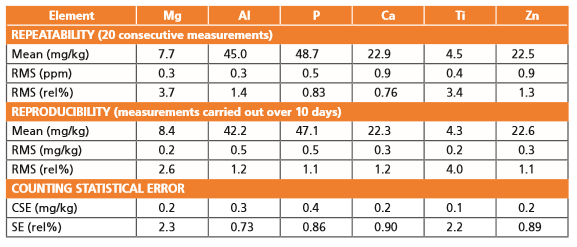
The precision, repeatability and reproducibility of the Polymers edition of the Zetium XRF spectrometer is outstanding, not only for short-term measurements (20 consecutive measurements, Table 2), but also for longer-term measurements (measurements carried out over a period of ten days). For comparison, the counting statistical error (CSE) is also shown in Table 2. Figure 1 gives a graphical illustration of the analytical precision of Zn.
20 consecutive measurements of a polymer sample demonstrate standard deviations better than 2 % relative at the 23 mg/kg level, e.g. 22.9 ± 0.2 mg/kg Ca. This level of precision is maintained for measurements carried out over a period of ten days, e.g. P, Al, Ca and Zn, illustrating the long-term stability of this system. Comparison of these precision measurements with the counting statistical error (theoretically, the minimum possible error) emphasizes the inherent stability of the instrument.
Table 2. Analytical precision
The accuracy of the calibration is presented in Table 3. The calibration RMS value is a statistical comparison (1 sigma) of the certified chemical concentrations of the standards with the concentrations calculated by regression in the calibration procedure.
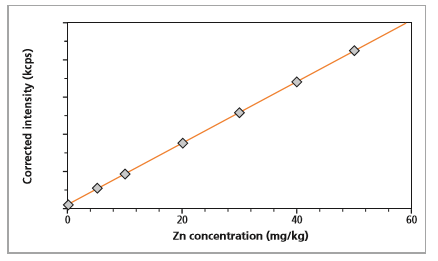
Calibration plots for Mg and Zn give a graphic illustration of the accuracy of the method (Figures 2 and 3).
Figure 1. Short- and long-term stability measurements of Zn in a polymer standard
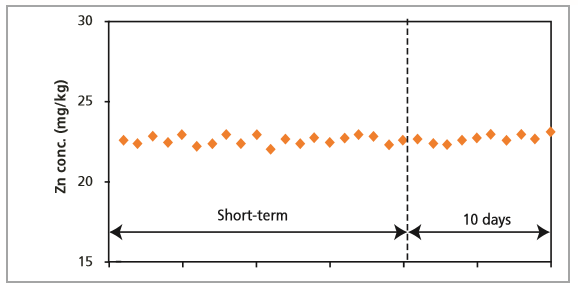
Table 3. Calibration quality
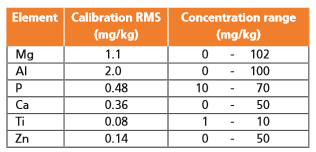
Figure 2. Calibration graph for Mg
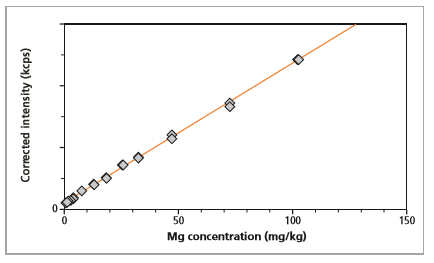
Figure 3. Calibration graph for Zn
Detection limits for the analytes of interest in typical polymer matrices are given in Table 4. The lower limit of detection (LLD) is calculated from:
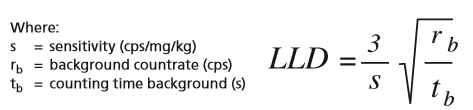
The LLD values are typical for the prepared polymer samples. LLD values for individual samples vary according to sample matrix composition.
Table 4. Detection limits
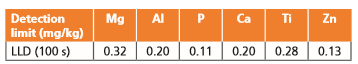
The results clearly indicate that the Polymers edition of the Zetium spectrometer is capable of analyzing light elements in polymer samples down to 1 ppm or less. Measurements are accurate and precise and the method benefits from simple, essentially hazard-free, sample preparation. The stability of the Polymers edition of the Zetium spectrometer is such that individual calibrations can be used for months. Time-consuming re-standardizations are unnecessary and the resulting data are highly consistent over time.