
Under current ICH Q10 guidelines, companies should be pursuing continuous improvement to their pharmaceutical processes. Changing the supplier for a given excipient can be a question of quality risk management and cost. By having access to alternative suppliers, the company can reduce risks in the supply chain, but will need to demonstrate comparability with the existing manufacturing process. This application note shows particle morphology comparison of an excipient from two suppliers, which supported the similar performance later seen in tablet disintegration tests. The proposed alternative supplier priced the excipient significantly lower than the current supplier, potentially leading to a significant reduction in cost of manufacture of the pharmaceutical product.
Two samples of an excipient were acquired from two different suppliers, and analyzed with automated image analysis using Malvern Panalytical's Morphologi 4. A 3 mm3 sample of each excipient was automatically dispersed using the Morphologi 4's integrated Sample Dispersion Unit (SDU) at the high energy setting. Each sample was measured using the 10× magnification lens to scan an area of 240 mm2 with the Sharp Edge image segmentation method.
Around 15,000 particle images were recorded in a 20-minute scan for each excipient sample. The Morphologi 4 software recorded and analyzed the images in terms of a variety of size and shape parameters. This data was then used to generate distributions and undersize charts, which were then used to compare the samples.
Figure 1 shows calculation of the Circular Equivalent Diameter (CED). A 2-dimensional image is taken of the three-dimensional particle. The area of the image is calculated and the diameter of a circle with the same area as the particle is used to give the size of the particle in microns. Figure 2 compares the CED undersize chart for the two samples, which shows a close overlay of particles from excipients 1 and 2, indicating high similarity in size.
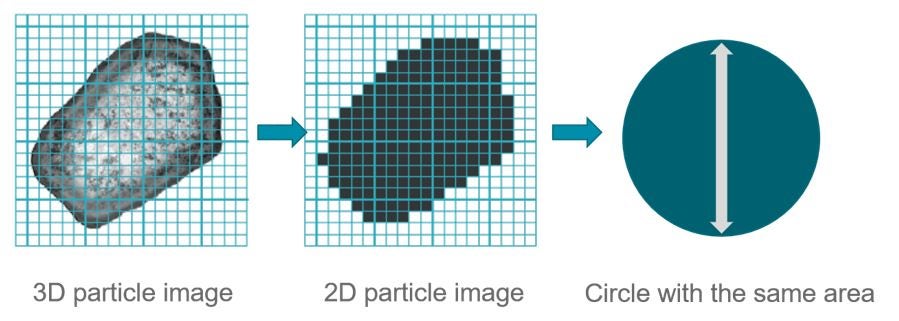
Figure 1. Calculation of Circle Equivalent Diameter
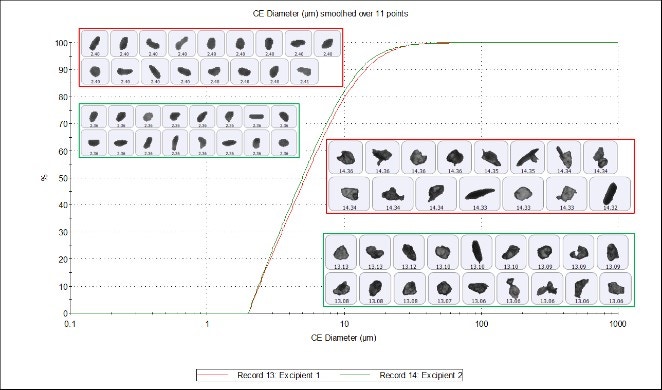
Figure 2. CE diameter undersize chart for excipient 1 (red) and excipient 2 (green)
Figure 3 shows that the width of the particle is divided by the length of the particle and the result subtracted from 1 to give the particle's Elongation. Particle length is defined by the longest axis that passes through the center of mass, and particle width is measured perpendicular to that axis; both are reported in microns. Subtle differences between the two samples are seen in the elongation undersize chart (Figure 4), where excipient 1 is slightly more elongated than excipient 2. However, these differences are marginal and the two samples can still be regarded as highly similar. The particle images show how the length and width of the particles appear more elongated at the upper end of the scale and are more isotropic at the lower end of the scale.
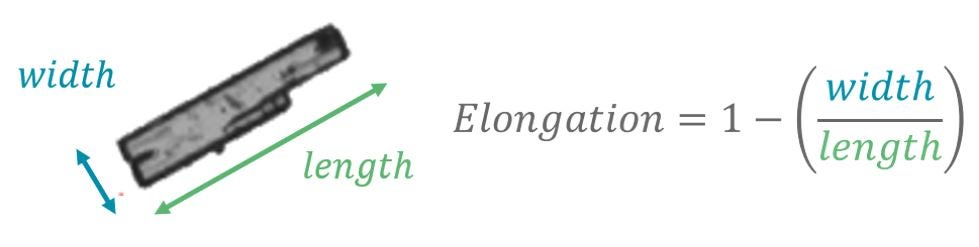
Figure 3. Illustration of calculation of particle width, length and elongation
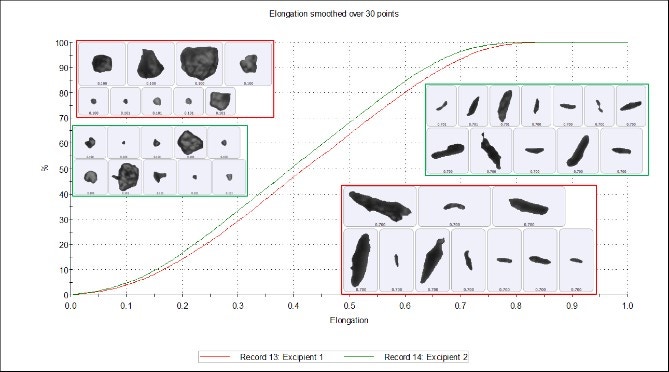
Figure 4. Elongation undersize chart of excipient 1 (red) and excipient 2 (green)
Figure 5 shows how the Solidity parameter is calculated using the convex hull, which may be described as the shortest distance around a particle image. Solidity is a ratio of the particle image area (gray area) to the convex hull area (the sum of the gray and green areas) and is sensitive to jagged edges often seen with agglomerates. Subtle differences can be seen in the undersize chart (Figure 6), which shows that excipient 1 is more jagged or agglomerated than excipient 2. However, these differences are again marginal and the two samples can still be regarded as highly similar.
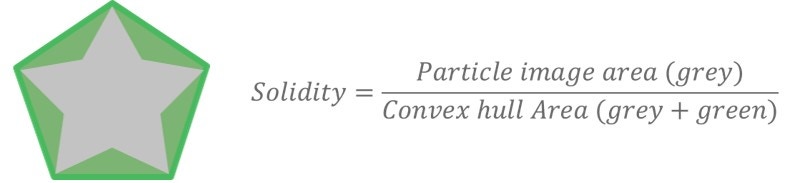
Figure 5. Illustration of the Solidity parameter and equation
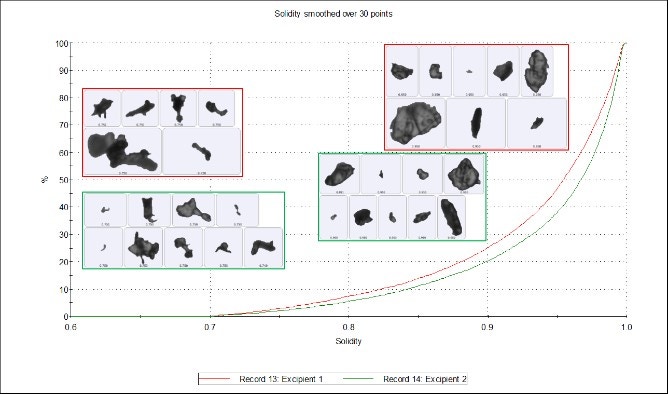
Figure 6. Solidity undersize chart of excipient 1 (red) and excipient 2 (green)
Figure 7 shows that Circularity is the ratio of the circular equivalent perimeter (blue line) to the image perimeter (green line). High Sensitivity (HS) Circularity is a ratio of the circular equivalent perimeter squared to the image perimeter squared, and is more sensitive to high values of circularity. Some differences can be seen in the HS Circularity undersize chart (Figure 8), which shows that excipient 2 is more circular than excipient 1, but again these differences are marginal and indicate reasonably high similarity between the excipients.
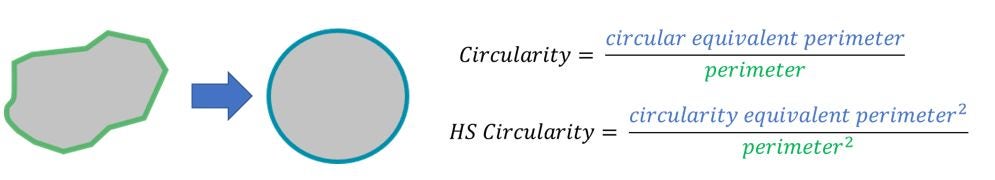
Figure 7. Circularity and High Sensitivity Circularity
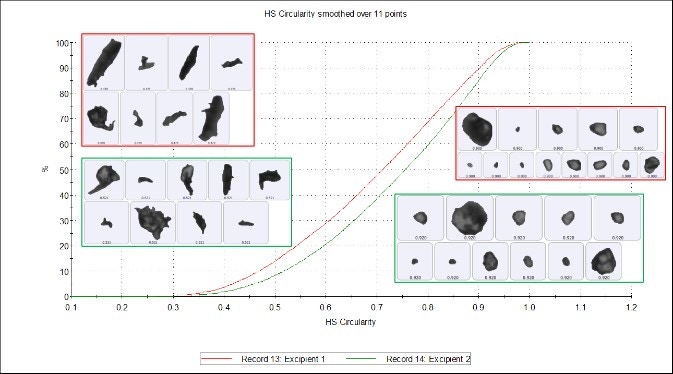
Figure 8. HS Circularity undersize chart of excipient 1 (red) and excipient 2 (green)
In general, the particle size and shape distributions are highly similar between the two excipients, but subtle differences exist for HS Circularity and Solidity. This is reflected in the Parameter Variability chart (Figure 9). The Parameter Variability chart is a visual indication of the variability between datasets for 14 size and shape parameters. The length of the bars is proportional to the variability. The green bar parameters are related to size, the red bar parameters are related to shape, and the blue bar parameter is related to light transmission. The variability is considered to be low for all parameters, with Circularity, HS Circularity and Solidity having the most variability. Hence, the two excipients were found to be highly similar.
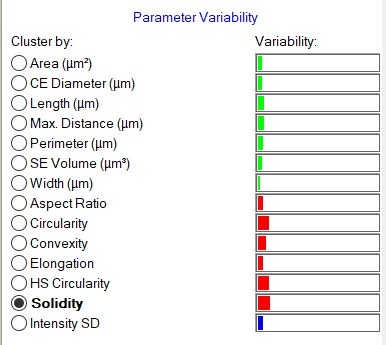
Figure 9. The Parameter Variability chart.
The high similarity in the size and shape of the particles between the two excipients is a first indication that the material properties of the excipients are comparable. This work was followed by disintegration tests of tablets prepared using the two excipients. The time for complete disintegration was found to be equivalent, which confirmed that the alternative excipient could be used for future production of the tablets.
By comparing the particle size and shape distributions of an excipient from two suppliers it was found that they were highly similar. Subsequent manufacturing tests confirmed comparable performance between the different excipients, hence the second, less expensive, supplier could be used as an alternative with low risk to the manufacturing supply.