
The nature of a particle size distribution analysis is dependent upon the manner in which the particles involved are weighted. Three different distribution weighting mechanisms are commonly used: number, volume and intensity [1]. An intensity distribution weights particles according to the amount of light they scatter, a volume distribution weights particles according to the volume they occupy, and a number distribution weights particles according to their concentration. This application note demonstrates practically the information that each distribution gives when applied to a protein formulation, and how the values generated by the different weightings can be used in conjunction to give a better idea of the nature of a sample.
A solution containing lysozyme, at a concentration of 140 µM, and arginine, at a concentration of 50 mM, was prepared and filtered using a 20-nm pore size filter. The sample was measured in triplicate using a Zetasizer Nano ZSP with a 633 nm He-Ne laser. Each measurement consisted of 15 runs, each run lasting for 10 seconds. Measurements were carried out at room temperature using a scattering detection angle of 173°.
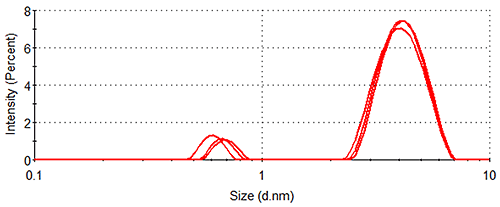
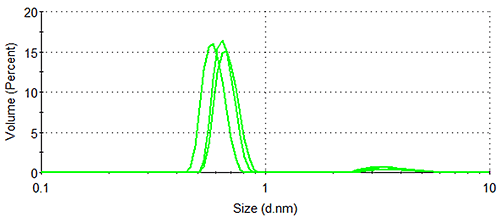
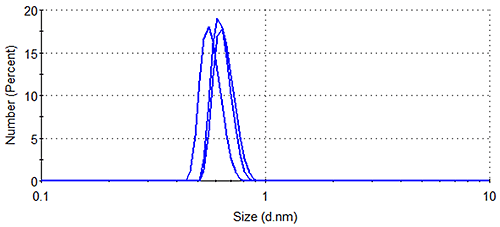
Figure 1 shows the size distributions generated upon application of different weighting mechanisms to the data, whilst Table 1 displays the statistical description of these distributions. It should be noted that no sub-nanometer peaks were detected during Dynamic Light Scattering (DLS) measurements of a similar sample containing no arginine, confirming the identity of the 0.6 nm - 0.7 nm particle as arginine.
Lysozyme, being substantially larger than arginine and therefore scattering much more light, dominates the intensity distributions, despite the concentration of the former being < 0.5 % that of the latter. The relatively high concentration of arginine means that the amino acid occupies a much greater volume of the sample than does lysozyme (despite individual arginine molecules being smaller than individual lysozyme molecules), as demonstrated by the volume distributions. As expected, the number distributions are completely dominated by arginine, the solution having been prepared so that > 350 arginine molecules are present for every one lysozyme molecule.
|
|
|
| Peak | Hydrodynamic Diameter (nm) | % Contribution to Distribution |
|---|---|---|
| Lysozyme | 4.18 ± 0.07 | 93.1 ± 0.8 |
| 3.69 ± 0.10 | 6.2 ± 2.1 | |
| 3.32 ± 0.11 | 0.0 ± 0.1 | |
| Arginine | 0.66 ± 0.05 | 6.9 ± 0.8 |
| 0.64 ± 0.04 | 93.8 ± 2.1 | |
| 0.62 ± 0.04 | 100.0 ± 0.1 |
In addition, it is noticeable that the number distribution gives a lysozyme hydrodynamic diameter that is < 80 % of that given by the intensity distribution (Table 1), suggesting that there are small lysozyme oligomers present in the sample. Since, according to the Rayleigh approximation, the amount of light scattered by a spherical particle with a diameter < 1/10 of the wavelength of the incident light is proportional to the diameter of the particle to the sixth power, such oligomers make a disproportionately large contribution to the intensity distribution. Using the calculators in the Zetasizer software, a lysozyme dimer can be estimated to have a hydrodynamic diameter of 5.0 nm (assuming a globular structure). A single dimer, therefore, can be expected to scatter ~5 times more light than a lysozyme monomer, whilst a lysozyme trimer, using the same method of calculation, would be expected to scatter ~15 times more light. Such oligomers would therefore make contributions to the intensity distribution ~5 and ~15 times greater, respectively, than the monomer contribution. The number distribution on the other hand, being a measure simply of the relative concentrations of different particle sizes in the sample, contains no such bias, hence the smaller average size for the lysozyme peak when weighted by number.
Assuming sphericity, particle volume is proportional to the diameter to the third power. Since smaller oligomers such as dimers and trimers have a larger volume than the monomer, they are over-represented in the volume distribution, though not to the same extent as in the intensity distribution. The difference between the effect of diameter on scattering intensity and its effect on particle volume, as well as its lack of effect on concentration, explains why the hydrodynamic diameter value given by the volume distribution is in-between the values given by the intensity and number distributions.
The fact that the distribution weighting has no significant effect on the calculated hydrodynamic diameter of arginine (Table 1), on the other hand, indicates that arginine does not aggregate in solution, which is as expected.
In addition to demonstrating the difference between intensity, volume and number distributions, this work also demonstrates the sensitivity of the Zetasizer Nano ZSP. The instrument is shown to be able to detect and provide a repeatable measurement for the hydrodynamic diameter of arginine, an amino acid with a relative molecular mass of 174 Da. That the instrument can do this in the presence of a 14700 Da protein bears testimony to the sensitivity of the Zetasizer Nano ZSP's Non-Invasive Back-Scattering (NIBS) detection method, the 173° detection angle being designed to allow maximum resolution of relatively small particles in the presence of larger particles.
Finally, the value of the different distribution weightings to the analysis of protein aggregation is demonstrated, the calculated hydrodynamic volume of the protein peak being reduced significantly when the intensity-bias of larger particles is removed, with such bias having little effect on the measured size of arginine.