Proteins consist of polypeptide chains that are sensitive to various treatment conditions such as preparation, storage, buffer, etc. This application note describes dynamic and static light scattering characterization of a therapeutic antibody supplied in two forms: an untreated and a treated preparation. Information about the treatment process was not divulged.
Two untreated antibody samples were provided at a concentration of 7 mg/mL in ammonium phosphate buffer. Both samples were also supplied in a treated form at various lower concentrations. All samples were filtered through a 0.1µm Whatman Anotop filter (cat. 6809-1012) and then measured in the 12µL cuvette of the Zetasizer Nano.
A series of dilutions of the untreated samples were then prepared in the same buffer to measure and compare the molecular weight by static light scattering.
Finally, an aggregation point determination was run for both a pure and a treated sample. The aggregation point, sometime referred to as "melting point", is the temperature at which a protein denatures. The Zetasizer Nano software allows automated temperature scans, and provides a calculation to determine the aggregation point temperature.
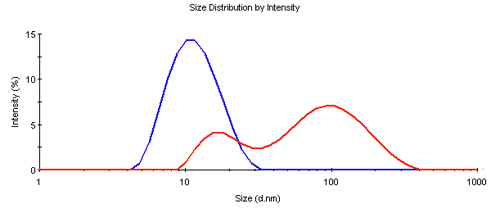
The dynamic light scattering measurements showed a significant difference between the treated and the pure samples. While the pure sample showed a typical z-average diameter (d.nm) of 11nm, the treated sample had a z-average size of 50nm, both with a polydispersity index (PDI) larger than 0.1 indicating more than a single species being present. This was confirmed by the size distribution analysis shown in Figure 1. The pure sample showed a single peak near the expected size, however the peak is broader than for a single species, indicating the presence of some fragments and oligomeric assemblies. The treated sample was clearly aggregated and significantly larger in size.
|
This result was confirmed with static light scattering measurements. The expected molecular weight of this sample was about 145 kDa. However, there were antibody fragments present which had not completely been removed during the purification. The static light scattering technique calculates a weight average molecular weight, and as shown in Table 1, the pure antibody samples exhibited a weight average MW slightly less than the expected value. It is quite likely that this discrepancy originated from the presence of smaller fragments. The molecular weight of the treated samples was significantly larger than the pure antibodies. This is in agreement with the measured size distribution: The treated sample contained a large amount of aggregates, and this gave rise to a large average molecular weight. The Zetasizer Nano software allows MW determinations even for samples larger than typical Rayleigh scatterers. For the treated samples a shape correction for spheres (RG = 0.774 RH) was applied to the data. The effect on MW was less than 10%.
| Sample | MW (kDa) | MW error (kDa) |
|---|---|---|
| San2-pure | 129 | +/- 21 |
| San3-pure | 139 | +/- 8 |
| San2-treated | 1210 | +/- 125 |
| San3-treated | 1270 | +/- 65 |
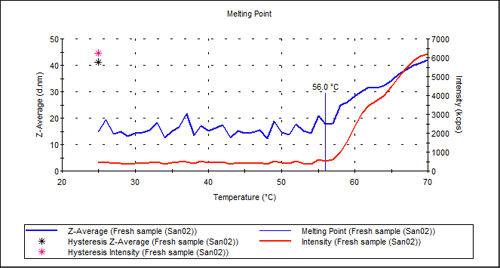
An automated temperature scan of the sample chamber allows observation of both the size and the scattering intensity as a function of temperature. The marked point where both the size and the intensity start to increase significantly is called the aggregation point. Here, denaturation of the molecules leads to massive aggregation, which manifests itself as both a larger size and a larger scattering intensity.
Figure 2 shows the aggregation point measurement for the pure antibody sample. There is a clear transition in the intensity plot at about 56°C. The hysteresis points show the value of size and intensity when the temperature was returned to 20°C. This indicates that the denaturing is not reversible simply by reducing the temperature.
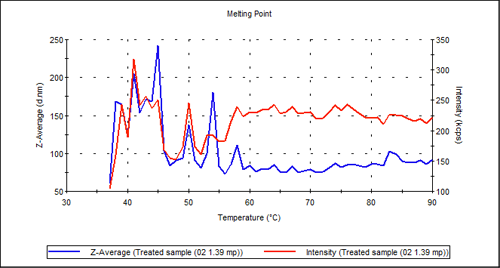
The treated sample shown in Figure 3 on the other hand, shows no transition at all: It appears as if the proprietary treatment has had a similar effect to temperature in denaturing the antibody.
|
|
The experiments clearly show the ability of the technology to differentiate between the two supplied samples and to enable the calculation of the aggregation point of the untreated sample. It is speculated that the treated sample has been through a denaturing process and no aggregation point could be observed.