
Quantum dots are uniquely highly scattering nanoparticles that can be used for image enhancement. The color and brightness of quantum dots are related to their size and optical properties, the peak emission wavelength is roughly proportional to the square of the quantum dot core size.
Quantum dot particles absorb photons at high energy (or shorter wavelength) and emit them at longer wavelength. Hence samples of quantum dots have colors in the visible, under irradiation with invisible UV light.
Dynamic light scattering (DLS) experiments use lasers that have a single wavelength output, and this wavelength can inadvertently excite fluorescence in the particles, leading to emission of a photon at a random, later time. This fluorescence, if detected, will reduce the quality of the data. Narrow band optical filters can remove the fluorescence signal and make the analysis of the size of quantum dots possible.
Two commercial quantum dot samples from Invitrogen, Seattle, WA, were measured at two different concentrations in borate buffer, pH 8.3.
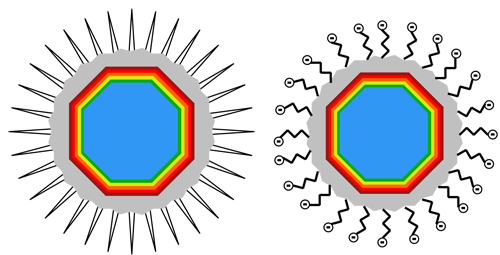
The peak of the emission spectrum of Qdot® ITK™ 655 is at 655nm which is close to the 633nm wavelength of a Helium-Neon laser. The particles contain a CdSe crystal core, with a ZnS shell, and are then either functionalized with carboxyl groups or polyethylene glycol (PEG) attached to the outer surface, as modeled in figure 1 for the two samples used in this study.
|
Samples of each were prepared at an approximate concentration of 1nM and 800nM. Their size and zeta potential were measured with the Zetasizer Nano ZS. The instrument was first used in its standard configuration, and then configured with a narrow band filter (transmission center wavelength at 632.8 nm). Low volume disposable plastic cuvettes were used for the size measurements, and the folded capillary cuvettes for the zeta measurements.
DLS measures the intensity fluctuations in the scattered laser light. These fluctuations are caused by constructive and destructive interference, and require the detection of coherent light from the scattering objects. Fluorescence consists of incoherent radiation, and if detected increases the background noise.
The Zetasizer Nano measures zeta potential using micro-electrophoresis. When an external electric field is applied to a sample containing charged particles, these will then move under the influence of the field. The movement is detected using a phase analysis light scattering (PALS) arrangement, where the scattered signal is compared to the reference (unscattered) light from the incident laser beam. In this case, the reference signal strength is typically much stronger than the scattering from the particles, and any incoherent light from the fluorescence will not cause such a marked deterioration in the data quality. This means that the narrow band filters are not in general required for zeta potential measurements.
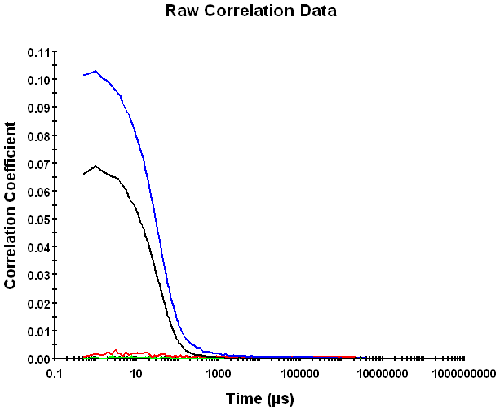
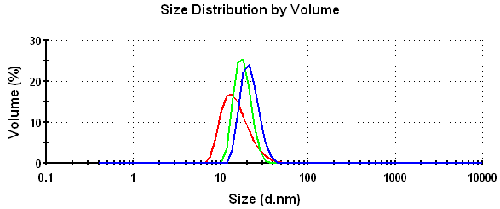
As shown in figure 2, the data and hence the size measurements are clearly influenced by the presence of fluorescence in these samples. It was not possible to measure the size of these quantum dots without the narrow band filters fitted. There was no detectable correlation function, with an intercept or signal-to-noise (STN) ratio much below 0.005. With the narrow band filter the intercept, although still low, increased significantly and yielded acceptable data quality. The volume particle size distributions obtained for the samples showed a monodisperse distribution for the carboxylated particles with a diameter of 16nm. The PEGylated samples were slightly larger at 18nm [1nM] and 22nm [800nM] and more polydisperse (figure 3).
|
|
The zeta potential measurements are hardly influenced by the presence of fluorescence in these samples (table 1). The mean zeta potential was -35mV for the carboxylated and -3mV for the PEGylated sample. With the narrow band filter the values are similar at -31mV and -3mV, respectively.
| Sample | Zeta Potential (mV) |
|---|---|
Qdot® ITK™ 655 carboxylated quantum dots without narrow band filter | -35 |
Qdot® ITK™ 655 carboxylated quantum dots with narrow band filter | -31 |
Qdot® ITK™ 655 PEGylated quantum dots without narrow band filter | -3 |
Qdot® ITK™ 655 PEGylated quantum dots with narrow band filter | -3 |
The significant difference in zeta potential results from -35mV (carboxylated sample) to -3mV (PEGylated sample) indicates that the nonionic moiety, i.e. the PEG molecules, are surface active and have adsorbed to the surface of the quantum dot sample.
PEG adsorbs to the surface of the Quantum Dot sample resulting in a lower zeta potential. Although it might be expected that the PEG adsorption could provide steric stability, the size results in this case do not indicate that the PEGylated sample is more stable. Instead the PEGylated sample results in a low zeta potential and a broad size distribution, indicating lower stability. As expected, the higher charge of the carboxyl groups, results in a more stable and homogeneous dispersion.
The narrow band filter option available in the Zetasizer Nano allows for successful size measurements of far-red quantum dots to be made that would otherwise not be possible.
The Zetasizer Nano system from Malvern Instruments includes the hardware and software for combined dynamic, static, and electrophoretic light scattering measurements, providing information about size, molecular weight, and zeta potential. The system was specifically designed to meet the low concentration and sample volume requirements typically associated with pharmaceutical and biomolecular applications, along with the high concentration requirements for colloidal applications. An optional narrowband filter can be incorporated to handle fluorescent samples.