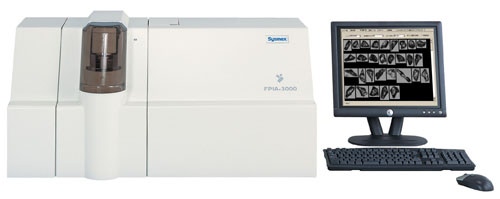
During the production of inhalation drug suspensions the elimination of large active drug particles is important to ensure efficient administration of the drug to a patient. The Sysmex FPIA-3000 Flow Particle Image Analyzer (Figure 1) is being used to monitor processes during the manufacture of an inhalation drug suspension so that the origin of any large particles, in a process, can be identified and thus the process can be improved to become more efficient.
|
The delivery of inhalation drug suspensions to the lungs is often carried out using a nebulizer. Nebulizers convert the drug suspension to a fine mist which can be breathed in via a mask or mouth piece. The droplet size is controlled to below 10 µm and thus the solid drug particles must be smaller than this. Nebulizers also ensure that oversized particles are not administered and additionally, the action of a nebulizer, forcing high pressure air through a small orifice, results in vibrational energy which causes loose agglomerates to break up thus allowing the drug to be administered more effectively.
During the manufacturing process of inhalation drug suspensions, it is possible that large particles may form. These might be large primary particles, hard aggregates or loose agglomerates. Characterizing the large particles may allow identification of the part of the process from where they arise. For example large primary particles may be an indication of ineffective homogenization.
In order to ensure efficient drug administration to the patient it is important that oversized particles, especially large primary particles or hard agglomerates, which cannot be dispersed by the action of the nebulizer, are eliminated during the manufacturing process, so they are not released by the nebulizer. Improved efficiency of administration of the drug by the nebulizer leads to a reduction in waste and thus increased profit.
The Sysmex FPIA-3000 Flow Particle Image Analyzer is an automated image analysis system that measures the size and shape of particles in suspension via a sheath flow cell by imaging flow cytometry and also provides images of all the particles measured. Since the instrument measures particles in suspension, it is ideal for monitoring the manufacturing process of inhalation drug suspensions. The system provides size and shape distributions for each sample measured along with a scattergram which depicts the size verses shape of the particles. If large particles are identified their recorded images, can be viewed allowing determination of whether they are primary particles or some form or agglomerate or aggregate. If the large particles are found to be primary particles it is an indication that there is a problem in the process and it needs to be altered.
In order to differentiate between agglomerates or aggregates, further measurements can be performed on samples which have been subjected to ultrasound before measurement. The application of ultrasound mimics the action of the nebulizer which would break up agglomerates. If the measurement post ultrasound shows there are no longer large particles present it can be assumed that the large particles observed in samples for which no ultrasound was applied were loose agglomerates and therefore the sample can pass the test. If large particles are still present after ultrasound then they are likely to be aggregates and this is another indication that the process needs to be addressed.
Analysis of a sample on the FPIA-3000 takes 2.5 mins and repeat measurements to ensure repeatability can easily be set up in the standard operating procedure (SOP). Repeat measurements of the same sample can also be merged to increase statistical significance if required. Alternatively the system can be set to measure a fixed number of particles.
Six samples of different batches of a suspended inhalation drug were measured on the FPIA-3000 in order to track the degree of agglomeration of the particle suspensions. The primary particles were in general less than 10 µm in diameter. Samples were measured on the FPIA-3000 with the 10 x objective lens and High Power Field (HPF) configuration which resulted in a total magnification of 20x. Three repeat measurements were performed on each sample which were then merged together to give the final result. The total analysis of all 6 samples with repeats took less than 1 hour. Size results in terms of Circular Equivalent (CE) diameter for the six samples are shown in Table 1.
| Sample Information | No of particles measured | Circular equivalent diameter (µm) | ||||
|---|---|---|---|---|---|---|
| Mean | Mode | D[n,0.1] | D[n,0.5] | D[n,0.9] | ||
| Sample 1 | 13616 | 2.61 | 0.59 | 0.87 | 2.10 | 5.09 |
| Sample 2 | 11170 | 2.94 | 4.11 | 0.98 | 2.56 | 5.48 |
| Sample 3 | 13923 | 2.37 | 1.96 | 1.02 | 2.08 | 4.09 |
| Sample 4 | 19050 | 2.94 | 1.58 | 1.03 | 2.53 | 5.34 |
| Sample 5 | 12353 | 3.07 | 2.92 | 0.98 | 2.41 | 5.87 |
| Sample 6 | 6069 | 3.77 | 1.67 | 1.13 | 2.48 | 8.75 |
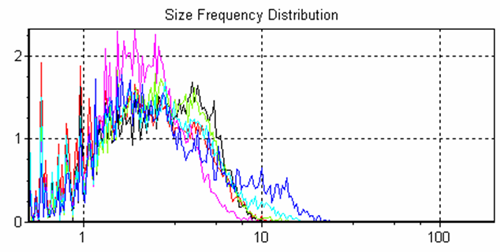
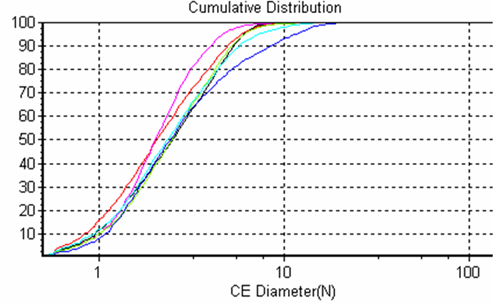
The system allows overlays of frequency size distributions and cumulative size distributions (Figures 2 and 3 respectively) of the different samples for quick sample to sample comparisons.
|
|
|
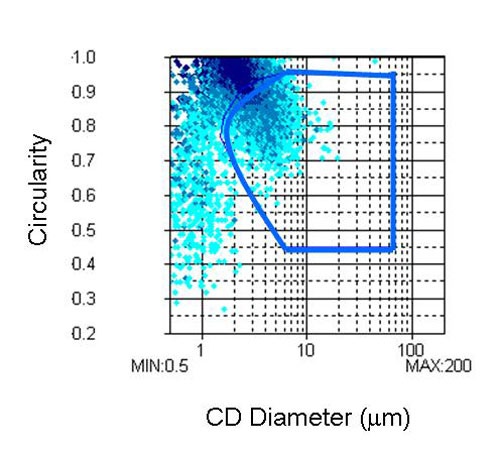
Analysis of the shape information provided by the FPIA-3000 gives information on the relative degree of agglomeration in the sample since agglomerates are generally found to have a lower circularity and larger particle size than the primary particles. Circularity is a measure of how close the particle's 2D projection is to a perfect circle. As well as size and shape distributions the FPIA-3000 also provides a scattergram depicting the size verses the shape of the particles as shown in Figure 4.
|
In this example the CE diameter of the sample is plotted against its circularity. The software allows a region of interest to be selected in the scattergram. For this study, two regions of interest were defined.
The aim of the first region was to separate, as far as possible, all of the agglomerates from the primary particles. The region of the scattergram chosen to represent the agglomerates is shown in Figure 4 and will be referred to as analysis 1.
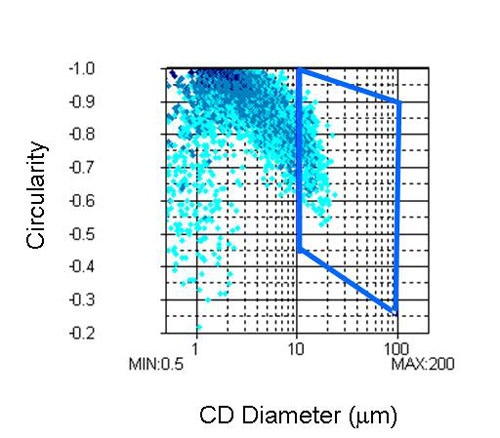
The second region, shown in Figure 5, was selected in order to compare the differences in the proportions of agglomerates larger than 10 µm from sample to sample. This will be referred to as analysis 2.
|
Table 2 shows the reported mean circularity for each of the samples and the proportions of the particles in each of the analysis areas described.
| Sample Information | Circularity – total distribution | Number % in described area | |
|---|---|---|---|
| Mean | Analysis 1 | Analysis 2 | |
| Sample 1 | 0.888 | 39.7 | 0.23 |
| Sample 2 | 0.904 | 40.9 | 0.04 |
| Sample 3 | 0.921 | 26.2 | 0.15 |
| Sample 4 | 0.908 | 38.2 | 0.53 |
| Sample 5 | 0.911 | 34.6 | 2.19 |
| Sample 6 | 0.900 | 35.9 | 7.32 |
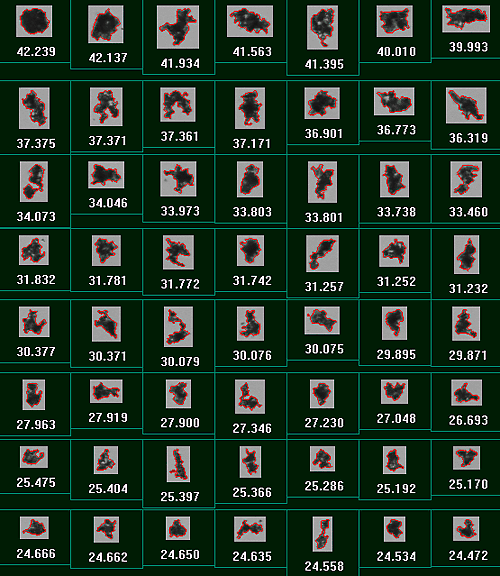
Sample 6 was found to contain the highest proportion of agglomerates larger than 10 µm. The result of analysis 2 for this sample showed the proportion of agglomerates it contained in number terms was 7.3%.
Sample 5 also showed a relatively high proportion of the large agglomerates with 2.19 % of particles in the defined region for analysis 2. All other samples contained significantly lower proportions of agglomerates larger than 10 µm.
|
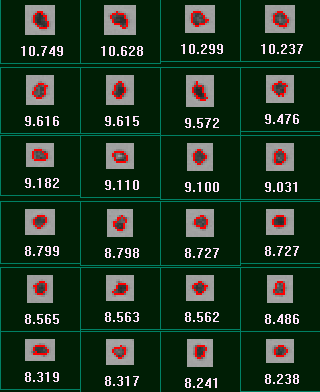
Figure 6 shows example particle images of the large agglomerates found in sample 6 along with their individual CE diameters.
Sample 3 showed a lower proportion of particles in the region defined in analysis 1 with 26.2% of particles in this region, which indicates it is the least agglomerated. This is also supported by the fact that sample 3 showed the highest circularity value of 0.921 for the total distribution. Further analysis of a highly agglomerated sample before and after sonication was carried out as described in Example Analysis 2 below.
Two aliquots of a sample of an inhalation suspension that was found to contain a high proportion of agglomerated particles was then analyzed before and after it was subjected to ultrasound to find out the proportion of oversized particles that would remain after mimicking the action of the nebulizer. The FPIA-3000 has an optional ultrasonic probe that allows the sample to be subjected to ultrasound immediately preceding a measurement. For this experiment the 10 x objective lens and Low Power Field (LPF) configuration was used which resulted in a total magnification of 5 x. Only one measurement was carried out on each aliquot of sample.
|
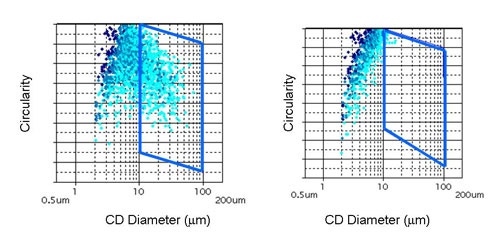
Figure 7 displays the results for the measurements before and after sonication in terms of the CE diameter Vs Circularity scattergram. Circular Equivalent (CE) diameter results for the sample before and after sonication are shown in Table 3 along with the mean circularity results and the proportion of particles larger than 10 µm. Images of the dispersed particles are shown in Figure 8.
| Sample Information | No of particles measured | Circular equivalent diameter (µm) | Circularity | Number % in described area | ||||
|---|---|---|---|---|---|---|---|---|
| Mean | Mode | D[n,0.1] | D[n,0.5] | D[n0.9] | Mean | |||
| Before US | 9551 | 4.87 | 3.60 | 2.51 | 3.64 | 7.72 | 0.893 | 7.09 |
| After US | 10613 | 3.78 | 3.60 | 2.39 | 3.63 | 5.51 | 0.92 | 0.26 |
|
It can clearly be seen from the scattergrams that almost no particles with a CE diameter greater than 10 µm remain after sonication. This is in agreement with the decrease in mean CE diameter and the increase in mean circularity that are also observed after sonication of the sample. These observations show that the number of agglomerated particles has been greatly reduced by the action of sonication and confirms that the large the agglomerates that were present before sonication were loosely bound and so are likely to be dispersed by the action of the nebulizer.
Analysis of samples from several batches of an inhalation drug suspension on the FPIA-3000 has allowed identification of samples that contain a higher proportion of large agglomerates. Investigations can now be carried out to determine what was happening in the process when the batches of sample with higher levels of agglomerated particles were produced. The process can then be improved to prevent the reoccurrence of large agglomerated particles therefore making it more efficient. Further analysis of the samples containing larges agglomerates before and after ultrasound was applied showed that the agglomerates were loosely bound and therefore the action of the nebulizer should break them up.
In the manufacture of inhalation drug suspensions and indeed other drug suspensions such as eye drops, it is important to monitor the process to ensure there are no oversized particles. The Sysmex FPIA-3000 Flow Particle Image Analyzer allows the measurement of size and shape of particles via simple Standard Operating Procedures (SOPs) in a fast, repeatable, routine analysis ideal for either Research or Quality Control purposes. This means processes can be closely monitored and any problems identified rapidly therefore improving efficiency and ultimately profitability of the manufacture.