Polysaccharides are biopolymers composed of mono- and di-saccharides linked by glycosidic bonds. Polysaccharides fabricated by nature are often used as an energy reserve by plants. These polymers can grow to large size and very large molecular weights. As for many polymers, the low molecular weight species are linear while the larger species have branches with an increasing number as the molecular weight increases.
Triple detection gel permeation / size exclusion chromatography (GPC/SEC) analysis is generally used to determine molecular weight distributions. It can also be used to determine the degree of branching present in the sample by using a viscometer detector. In this communication two samples identified as branched polysaccharides and one sample identified as a corresponding linear polysaccharide were analyzed for molecular weight distribution (MWD) and branching by triple detection chromatography.
The polysaccharides samples were dissolved in 0.1M NaNO3 heated to 65 °C for 4 hours then filtered using 0.2 μm nylon filters. The two branched samples and the linear reference were then analysed using a Viscotek triple detector array (TDA) system for detection and the Viscotek GPCmax pump/autosampler combination system for the solvent and sample delivery. The columns used were the ViscoGel GMPWXL 30 cm by 7.8 mm columns. The column and detector temperature inside the TDA was held constant at 30 °C. The samples were prepared at concentrations around 1 mg/mL. The volume of all the injections made through the variable injection volume autosampler was fixed at 100 μL. The flow rate delivery was constant at 1 mL/min. The OmniSEC software was used to control the GPCmax injection sequence and solvent delivery. The same software was used for the advanced detection acquisition and calculations. Low angle light scattering (LALS) was used to determine the molecular weights due to the large size for the samples, particularly the linear reference material. LALS is the preferred light scattering technique for polysaccharides as it measures the molecular weight directly without assumptions or fitting of data as with other light scattering techniques. The OmniSEC software automatically switches to the RALS detector when the molecules become small enough.
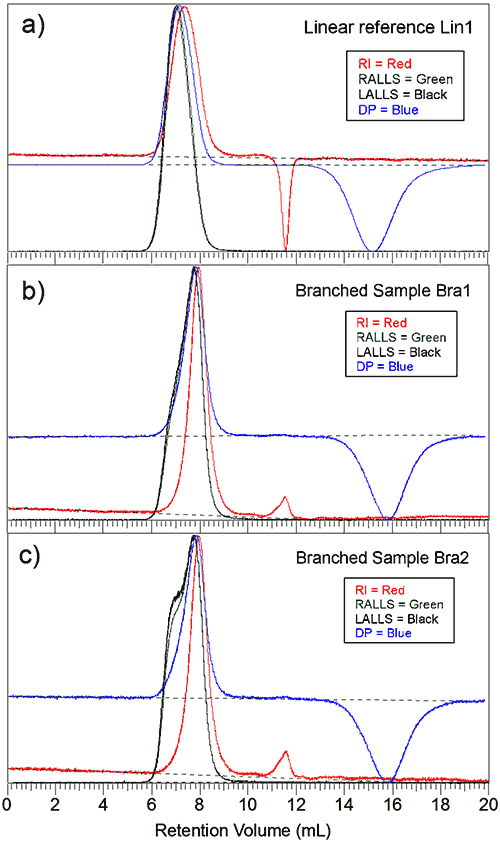
Figure 1a is the triple chromatogram for the linear reference sample. The Y-axis is the normalized intensity for each detector. The main polymer peak elutes at 7 mL followed by the solvent peak at 11.5 mL, seen as a negative peak for the RI signal, and finally the viscometer holdup peak, measured by the viscometer at around 15 mL. The two light scattering signals superpose well. They peak at the same elution volume as expected.
|
Although the inter-detector delay has been taken into account the viscometer and the RI signals peak after the light scattering signal, indicating sample polydispersity . It should be noted also that the signals resemble a Gaussian type distribution curve that is often seen for linear polymers.
Figure 1b is the advanced chromatogram for the first branched sample. The peak shows additional material detected at lower elution volumes, especially for the light scattering signals. Figure 1c is the second branched sample. The peak shows an even stronger signal on the left side of the main peak. Both branched samples peak at a higher elution volume than the linear reference sample.
In order to determine the degree of branching for a sample, a linear analogue of the sample must be available. From the similar polymer, a Mark-Houwink (MH) plot is constructed by plotting the intrinsic viscosity versus the molecular weight on a log-log scale. The slope and intercept of the fit are the Mark-Houwink and Log [k] values respectively. The MH parameters from literature could be used, especially in the case of well characterized polymers. In this case, the linear sample of the polysaccharide was measured directly.
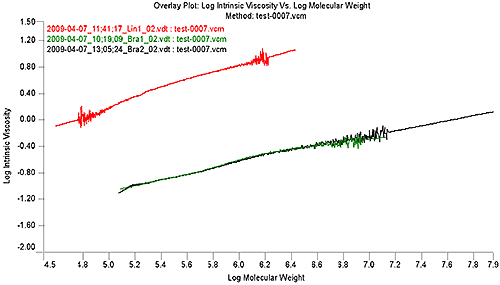
Figure 2 shows the MH plot of the linear sample in red. It is evident in the Mark-Houwink plot that the distribution of the linear reference sample does not extend to the high molecular weights of the two branched samples, however, the OmniSEC software allows an extrapolation of the data to cover the range of a branched sample. This allows a continued comparison of the sample with the linear reference.
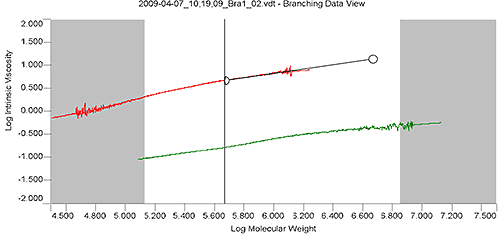
Figure 3 shows the overlay of Mark-Houwink plots for branched sample "Bra1" and linear sample "Lin1" in the Branching View of the OmniSEC software. The extrapolation tool (black line with handle) and the calculation limits (between the grey areas) are overlaid on the "Lin1" plot. The extrapolation tool allows the user to extend the slope of the linear sample's Mark-Houwink plot to either higher or lower molecular weight in order for the linear Mark-Houwink plot to cover the entire range of the branched sample. The calculation limits define the range of data over which the calculations will be performed. In this case the extreme high MW portion of the distribution was excluded from the calculations because of the reduction in data quality as the peak reaches the baseline of the branched sample "Bra1".
|
|
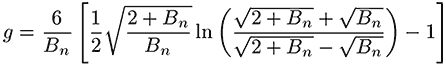
The branching number and branching frequency is calculated according to the Zimm-Stockmayer equation for a polydisperse, randomly branched polymer. The high degree of branching present in these samples means that the sample at each elution volume is polydisperse.
|
In equations 1 and 2, Bn is the number of branches calculated using the ratio of the intrinsic viscosities for the branched divided by the linear polymer.
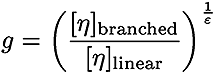
|
In Equation 3, ε is the shape factor (typically around 0.75)
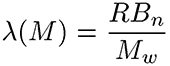
The branching frequency (λ) normalizes Bn to the molecular weight and the repeating units of the polymer
Where R is the repeat unit and Mw is the molecular weight.
|
A repeat unit of 18,200 Daltons was used for these calculations. This value is the equivalent of 100 glucose units and is a common value for the repeat unit in polysaccharides. The results for the 3 polymers are given in table 1. Although the molecular weight of the branched species are about twice the molecular weight of the linear polysaccharide, their sizes are less than half the one of the linear polysaccharide, clearly showing how compact a polymer gets when there is chain branching.
ID | Ma (Da) | Mw (Da) | Mz (Da) | [n] (dL/g) | Rh (nm) | Rg (nm) | MH a | MH Log K | Branches / Molecule | Branch Freq. |
|---|---|---|---|---|---|---|---|---|---|---|
| Lin1 | 265,800 | 385,813 | 527,215 | 3.792 | 27.7 | 40.0 | 0.602 | -2.76 | Linear Reference | |
| Bra1 | 348,122 | 618,234 | 2,123,000 | 0.164 | 10.9 | N/C | 0.485 | -3.541 | 1483 | 64.0 |
| Bra2 | 378,052 | 837,299 | 7,819,000 | 0.178 | 11.8 | N/C | 0.461 | -3.404 | 1467 | 56.2 |
These samples showed a very high degree of branching; as evidenced from the branching frequency, which is based on 100 glucose units. The branching frequencies of 64 and 56 may therefore be interpreted as equivalent to 64% and 56% of the glucose units having branches. This type of calculation is only possible utilizing both light scattering and viscosity data. Measurement of the size by angular dependent light scattering alone is impossible because the branched molecules have a radius below 15 nm and do not exhibit enough anisotropic light scattering to reliably determine the size for branching calculations.