Chocolate is an affordable yet luxurious treat with mature markets in Europe and North America and developing markets around the world. The secret of chocolate’s almost universal appeal is in the mouthfeel – the “snap” of the first bite, how the chocolate melts and how it coats the inside of the mouth. Despite being a consumer experience, mouthfeel is strongly related to the materials science of chocolate as a composite material.
The particle size and rheology of the chocolate are critical factors in determining and predicting mouthfeel. In this whitepaper we will describe how laser diffraction and rheology can be used to characterise the mouthfeel of chocolate.
Chocolate is one of the world’s favourite snack foods: over $100 billion was spent on chocolate in 2015 [1]. The unique appeal of chocolate lies in its taste, aroma and mouthfeel, or texture. These three attributes combine into the complex flavour of chocolate. As the natural ingredients of chocolate vary according to growing conditions, chocolate manufacturers go to some lengths to ensure the flavour of their chocolate products is consistent with their signature flavour. As with many food products, consumers are intensely loyal to their favourite brands and resist any changes to the flavour they expect [2]. Ensuring that the signature flavour is replicated across batches requires correlation of analytical techniques with expensive sensory testing, since it is not feasible to taste test every batch that emerges from a chocolate factory, however desirable that job might be!
Several factors are considered important for increasing the appeal of chocolate. These include:
The textural component is critical: as consumers we prefer a smooth chocolate to a “gritty” one, and we tend to assume a smooth chocolate is a more luxurious product. Extensive consumer testing by chocolate manufacturers over decades has established that particles of cocoa solids, sugar and milk are detected as a gritty mouthfeel at sizes over 30 µm. However, the particle grinding processes in chocolate manufacture are expensive, lengthy and energy intensive so large-scale manufacturers optimise their processes to achieve the required particle size as efficiently as possible. This optimisation is underpinned by regular particle size measurements, which are increasingly performed by laser diffraction instruments.
While particles affect grittiness, the flow properties of the fat phase (cocoa butter, which may be mixed with other fats) control how the chocolate coats the mouth and influences the perception of flavour. The flow, or rheological, properties of the chocolate also have significant impact on the chocolate manufacturing process. Reducing the particle size increases viscosity, potentially causing blockages as the liquid chocolate is piped through the factory. The final product may be a bar, or tablet, of solid chocolate, or the chocolate may be used in an enrobing process to surround a filling centre. Chocolate for enrobing processes is often optimised to achieve good coverage and may have a different recipe than chocolate for tablets.
Laser diffraction enables rapid measurements of particle size across a wide dynamic range, conveniently and close to the production line. Samples can be obtained from intermediate steps in the process, such as after grinding, and from the final product to ensure that the particle size distribution meets the manufacturer’s requirements.
The particles in chocolate are suspended in a matrix of fat. For measurement by laser diffraction, shavings of chocolate are immersed in a miscible oil or alcohol and agitated to release the particles and suspend them. The suspended particles can then be circulated through the measurement cell of a laser diffraction system, where they will scatter the laser light. The spacing and intensity of the rings in the diffraction pattern is related back to the particle size distribution by use of optical models defined by Fraunhofer, the industry standard, or Mie. The particle size result is obtained within minutes of obtaining the sample, enabling constant monitoring of the production process and the product quality.
Dark, milk and white chocolates from a single range and brand of chocolate were selected for measurement to minimise variations in the chocolate manufacturing process and ingredients. The particulate ingredients of dark, milk and white chocolates are shown in table 1.
| Cocoa solids | Sugar | Milk powder | |
| Dark | Y | Y | |
| Milk | Y | Y | Y |
| White | Y |
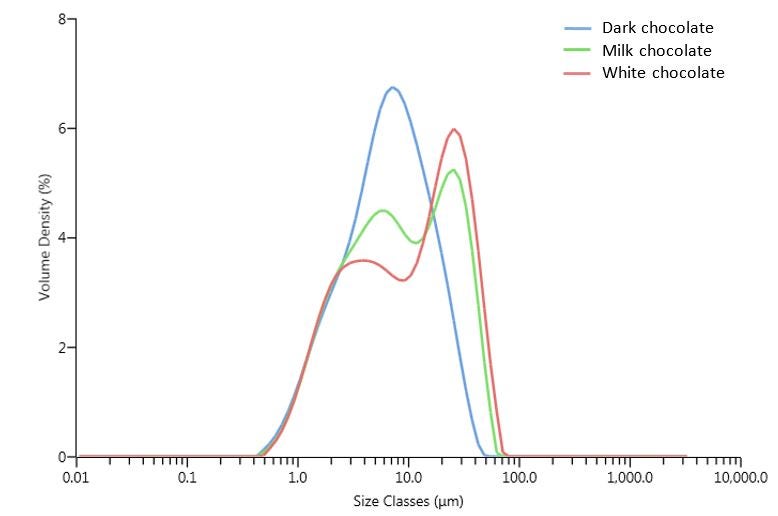
Figure 1: The particle size distributions of different types of chocolate made by one manufacturer.
There are clear differences in the shape of the particle size distribution between the three types of chocolate (figure 1). There are common features: a mode of large particles at approximately 30 µm and a mode of smaller particles at approximately 5 µm. Note that the 30 µm mode is present as a slight shoulder in the dark chocolate. The proportion of these modes varies with the type of chocolate and may be related to the presence and proportion of the different ingredients. For example, the large mode appears to correspond to the increasing sugar content from dark to milk to white chocolate. As there is a much smaller proportion of these large particles in the dark chocolate, it will be perceived by consumers as having a smoother, and more luxurious, texture than the others.
| Dv10 (µm) | Dv50 (µm) | Dv90 (µm) | Dv95 (µm) | Dv98 (µm) | %>30 µm | |
| Dark | 1.74 | 6.62 | 19.5 | 24.5 | 30.3 | 2.13 |
| Milk | 1.77 | 8.32 | 32.5 | 39.2 | 46.0 | 12.6 |
| White | 1.77 | 10.8 | 37.0 | 44.4 | 52.2 | 17.3 |
The increase in particle size from dark to milk to white chocolate can be followed seen in Dv50 and Dv90, while Dv10 does not change significantly (table 2). As the main interest for chocolate manufacturers is detecting the presence of large particles, the critical parameter is often Dv95 or even Dv98, where we can detect significant differences between the chocolate types. Alternatively, the proportion above 30µm can be obtained directly from the analysis.
In the early days, the addition of milk was problematic because milk was a seasonal product and was out of season when the manufacturers wanted to make chocolate to sell at Christmas. Two solutions were found to this problem: the use of dried milk powder and the use of crumb. Crumb is made by drying milk, sugar and cocoa solids together, creating composite particles [4]. The dried crumb powder can then be stored for use throughout the year. The crumb process is more expensive and fresh milk is now available throughout the year. However, crumb gives a different flavour profile from the powder process and it is still used to maintain the signature flavour of particular brands.
The particle size distributions from powder and crumb chocolates made by the same manufacturer are shown in figure 2 and the particle size statistics are shown in table 3.
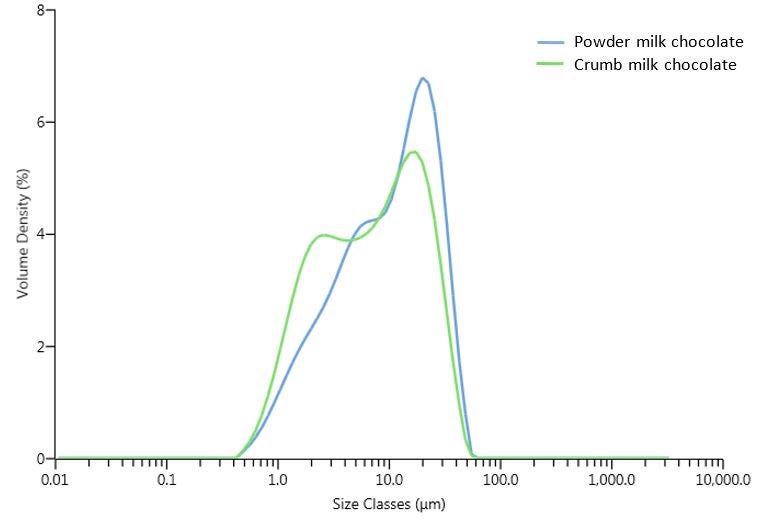
Figure 2: The particle size distributions of powder and crumb milk chocolates made by one manufacturer.
Dv10 (µm) | Dv50 (µm) | Dv90 (µm) | Dv95 (µm) | Dv98 (µm) | % > 30µm | |
Powder | 1.93 | 10.5 | 29.3 | 34.7 | 40.4 | 9.21 |
Crumb
| 1.48 | 7.22 | 25.0 | 30.6 | 36.8 | 5.43 |
The mixed material nature of chocolate is again apparent with a multimodal particle size distribution. The two main modes are much closer together in powder chocolate than in the crumb chocolate. There is a tail of fines in the powder chocolate that isn’t present in the crumb. These features give the crumb and powder chocolates each a distinctive profile in the particle size distribution and a distinctive texture. The source of these differences lies in the different recipe and processing routes. The crumb chocolate has a lower Dv90 than the powder chocolate and so will be perceived as being the finer chocolate by the consumer. This may be a true reflection of the quality of the chocolate, or it may be related to the flavour profiles and textures associated with each brand. In this case it is likely that the crumb chocolate had longer, and more expensive, grinding stages than the powder chocolate, as the composite particles in crumb enter the process with a larger particle size than milk powder.
Enrobing chocolate should flow well enough to easily encase the centres, but also be viscous enough to form a complete shell as the chocolate cools. A broader particle size distribution generally results in a less viscous fluid and consumers are less concerned with a smooth mouthfeel when they are focused on the centre of the chocolate. A chocolate with flow properties optimised for the enrobing process may have a different composition of fats as well as containing larger particles than a tablet chocolate.
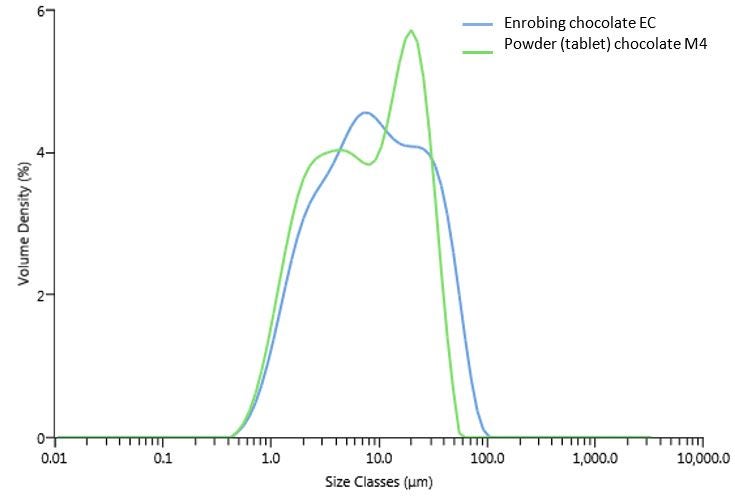
Figure 3: The particle size distributions of a powder (tablet) milk chocolate and an enrobing milk chocolate.
| Dv10 (µm) | Dv50 (µm) | Dv90 (µm) | % > 30µm | |
| Enrobing | 1.77 | 8.56 | 37.9 | 15.7 |
| Tablet | 1.58 | 7.72 | 27.4 | 7.45 |
The most fundamental rheological measurement made on chocolate is a viscosity measurement. A small quantity of sample is sheared at a fixed rate (speed), and the stress (force) required to achieve this shear rate is measured. The shear viscosity can then be calculated by dividing the shear stress by the shear rate.
Dark, milk and white chocolates from a single range and brand of chocolate were selected for measurement to minimise variations in the chocolate manufacturing process and ingredient variation. The particulate ingredients of dark, milk and white chocolates are shown above in table 1.
The dark chocolate has the lowest viscosity across the measured shear rate range and will be easiest to pipe around the plant (figure 4). Interestingly, the milk chocolate has a higher viscosity but a similar yield stress to the dark chocolate (table 5). This suggests the milk chocolate and dark chocolate will have similar “slump” properties and will fill moulds in a similar way. The white chocolate has the highest viscosity over the range and the highest yield stress by some margin. White chocolate is known to students of cookery and confectionery as being the most difficult to work with, and in this case, it certainly has very different rheological properties.
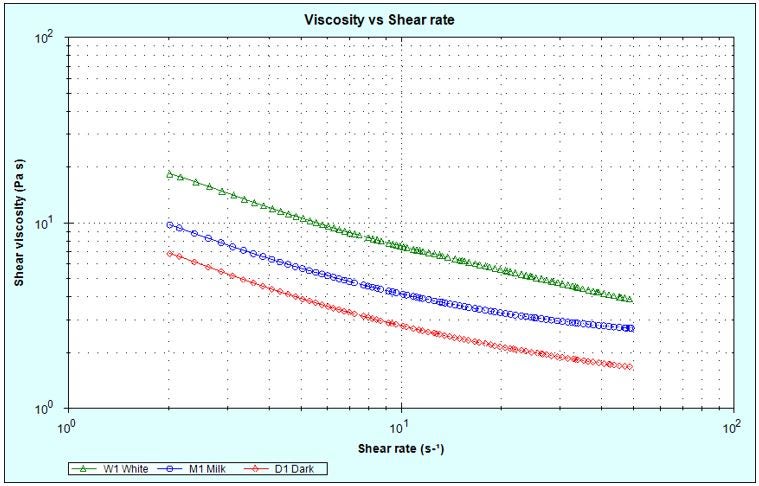
Figure 4: Viscosity vs shear rate for dark, milk and white chocolates produced by the same manufacturer.
| Yield stress (Pa) | Shear viscosity (Pa s) | |
| Dark | 5.03 | 0.94 |
| Milk | 5.71 | 1.66 |
| White | 18.9 | 1.86 |
Further insights in to the rheological properties of chocolate can be determined using oscillatory testing on a rotational rheometer. This provides additional information about the viscoelastic properties of chocolate through the elastic modulus (G’), viscous modulus (G’’) and phase angle (δ). It also provides an alternative method to steady shear testing for determining the yield stress. The elastic and viscous moduli relate to the microstructural characteristics of the chocolate and can be used to probe component interactions and melting characteristics of chocolate by evaluating the solid-like and liquid-like properties. The yield stress, which is the stress is required to break down the solid structure and make it flow, influences how the chocolate will coat the moulds and how well the chocolate will cling to the walls of the mould or slump before it sets.
Oscillatory measurements are non-destructive tests which show how the material behaves under small deformations or forces - before the material yields and starts to flow. The stress or strain region in which this behaviour occurs is known as the linear viscoelastic region (LVR). By measuring G’ as a function of shear stress the yield stress of the structure can be determined - this is generally taken as the stress at which G' starts to drop and the LVR ends [5]. It is important to note that different yield stress methods may give slightly different answers. For example Casson and Winhab models are commonly used for determining yield stress of chocolate by extrapolating a steady shear plot of shear stress vs shear rate to zero shear rate. Although oscillatory testing is less common it has been shown to be able to better resolve differences between chocolates [6]. For the milk chocolate tested, the yield stress was found to be 0.45Pa (figure 5).
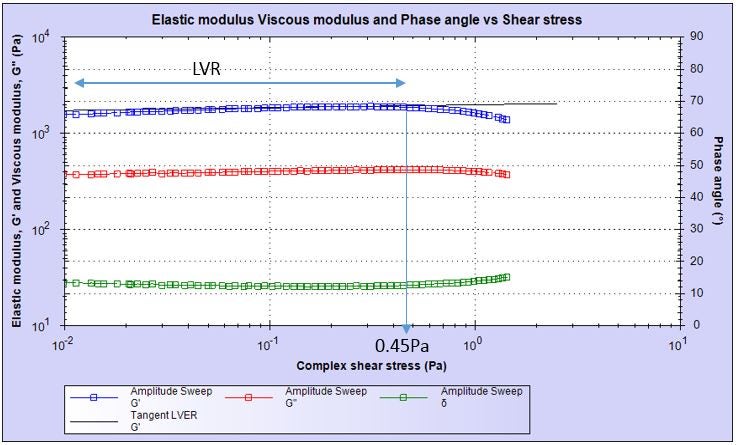
Figure 5: an amplitude sweep for milk chocolate showing the LVER and yield point at 0.45Pa.
Extending conventional rotational rheometry by employing the axial capabilities of the Kinexus enables mastication, or the action of chewing, to be simulated [7]. From this test, the hardness, yield stress, coating of the roof of the mouth and stickiness of the chocolate can be objectively assessed.
Monitoring the normal force generated during a measurement gives an indication of how the chocolate will melt, flow and coat the inside of the mouth as it is eaten. In this cyclical test, the material experiences both shear and normal (squeeze) forces. As the gap is compressed the normal force increases (figure 6, point A) and we might call this the hardness or consistency of the sample. The residual force after compression is the yield stress of the chocolate (figure 6, point B). The area under the curve as the normal force reaches zero indicates how long the chocolate remains in contact with the upper plate. This mimics how the chocolate coats the roof of the mouth. As the gap is increased once again, a negative normal force is recorded which could be classed as the adhesiveness (figure 6, point C). The residual force after decompression is the “stickiness” of the chocolate (figure 6, point D).
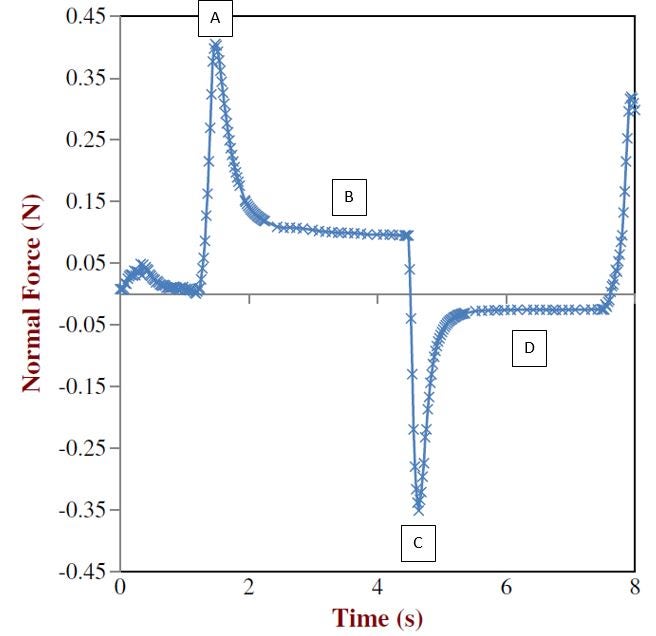
Figure 6: The mastication test. A = consistency, B = yield stress, C = adhesiveness, D = stickiness [6].
Three different milk chocolates were subjected to mastication simulation by conducting a normal force and shear measurement on the Kinexsus (figure 7). The premium chocolate has the softest consistency and the enrobing chocolate is significantly harder. The yield stress of the enrobing chocolate is also high and this chocolate will coat the mouth for longer than both the tablet chocolates, giving the consumer a satisfying chocolate hit despite the relatively low proportion of chocolate in the product (this product will contain a centre). The premium chocolate has the least adhesiveness and stickiness. This is desirable as high adhesiveness or stickiness can be associated with a cloying mouthfeel. As there is less chocolate present in the consumption of an enrobed chocolate product, these parameters have less influence on the consumer experience than in a chocolate tablet.
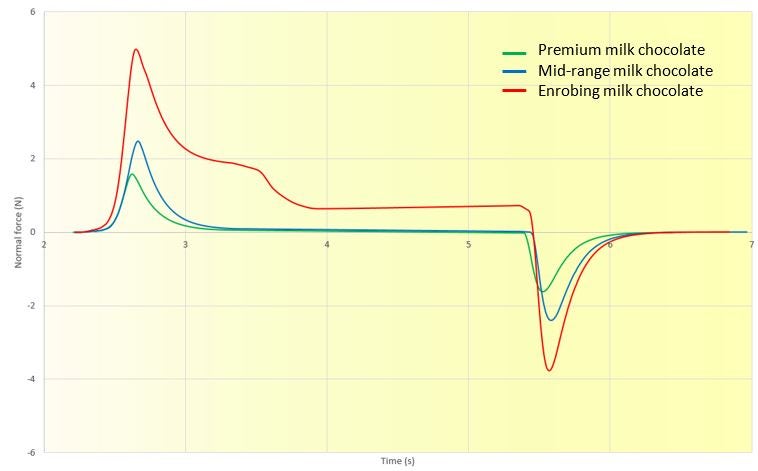
Figure 7: normal force vs experiment time for milk chocolates during a mastication simulation test.
The texture, or mouthfeel, of chocolate is critical for the consumer perception of product quality. By correlating expensive sensory testing with analytical results it is possible to finely control the textural aspects of the signature flavour of chocolate brands. The mouthfeel can be characterised through the determination of particle size, by laser diffraction, and flow, by rheology. It is even possible to use rheological methods to simulate mastication and thus predict or control the structural changes in the chocolate as it is consumed.
[1] www.theguardian.com/news/datablog/2015/jul/19/which-country-spends-the-most-on-chocolate-bars
[2] www.independent.co.uk/news/uk/home-news/creme-egg-easter-cadbury-mondelez-recipe-sales-a6950221.html
[3] www.howitworksdaily.com/why-is-chocolate-so-tasty/
[4] Beckett, S. (2008) The science of chocolate (2nd edition) RSC Publishing
[5] Chan, F. and De Kee, D. (1994) Yield stress and small amplitude oscillatory flow in transient networks. Industrial & engineering chemistry research, 33(10), p2374-2376
[6] De Graef, V., Depypere, F., Minnaert, M., & Dewettinck, K. (2011). Chocolate yield stress as measured by oscillatory rheology. Food Research International, 44(9), 2660–2665.
[7] Chung, C. et al. (2012) Instrumental mastication assay for texture assessment of semi-solid foods: compile cyclic squeezing flow and shear viscometry. Food research international, 49, p161-169
Websites accessed September 2016.