
NanoSight instruments with Nanoparticle Tracking Analysis (NTA) technology from Malvern Instruments can be used to analyze the size and concentration of particles from the light they scatter. In addition, with appropriate experimental design, NTA may also be used to characterize fluorescent particles by detecting the fluorescence signal which is emitted naturally by particles or as a result of fluorescence labeling or tagging.
This technical note discusses the process of fluorescence detection in NTA and the considerations necessary for a researcher to exploit fluorescence in their research.
Fluorescence labeling can be utilized in any situation where it is necessary to distinguish a particular subset of particles within a complex background, to confirm the presence of similar particle type, to specifically recognize the tags on the particle surface or to target internal content inside biological or manufactured particles. Some examples where fluorescence labeling may be useful include drug delivery nanoparticles, small biological particles including extracellular vesicles, virus particles or virus like particles (VLPs). The type of labeling used will be dependent on the type of particle to be labelled and the experimental objectives.
Some materials naturally exhibit fluorescent properties, whilst for others it is possible to incorporate fluorescent molecules into nanoparticles during their synthesis or manufacture. However it is more common, especially when considering biological nanomaterials, for the particle to be labelled with fluorescence after it has been produced. There are a number of approaches when can be used to label particles and these are discussed below.
Physiological labeling is typically used to distinguish particles of interest from contaminants. This labeling targets particular components such as all lipids, proteins, sugars or membrane-bound particles within a sample, by using a dye that has an affinity for this component. For example, during purification and isolation of bio-particles, semi-specific labeling can be used to monitor the effectiveness of the vesicle purification method. In this example, in scatter mode all particles would be included, but in fluorescence mode only those particles with a membrane would be measured. Sometimes the fluorescence activity of the dye is only ‘switched on’ when it becomes attached to the molecule of interest, as, for example, some lipid membrane dyes.
Particle labeling can be very specific, for example when using a fluorescently- labelled antibody to target a known antigen marker on a particle of interest within a mixed sample. This type of labeling is often useful when studying small biological particles such as exosomes or microvesicles to monitor the proportion of fluorescent-positive particles in the “healthy sample” compared to the “disease state sample”.
Specific antibody labeling can also be achieved via primary and secondary antibody link where primary antibody is used to recognise a specific particle marker and secondary antibody carries fluorophore and attaches to primary antibody. Alternatively, the very strong binding system of biotin – (strept)avidin is commonly used in 2 step labeling process. Typically biotin is attached to the primary partner and the fluorophore is conjugated to streptavidin. Biotin/streptavidin can be attached to the particle via antibody or can be engineered onto the particle surface.
In the case of drug delivery nanoparticles, it is possible to fluorescently tag or load these particles and distinguish them within a complex medium, such as mucin. The mucin itself is highly complex, containing particles that would be seen in large numbers under normal light scatter mode, making it impossible to see or track the small drug delivery nanoparticles. By fluorescently tagging or loading them, it is possible to then only track and measure the labeled particles when measuring in fluorescent mode.
Some biological particles like viruses or exosomes carry various nucleic acids that can be tagged by selective nucleic acid dyes. In this case the fluorescent marker has to be able to enter into the particle to bind to the nucleic material and the signal has to be strong enough to be transferred through the vesicle membrane or capsid for its detection. Some dyes only exhibit their fluorescent properties once incorporated into the genetic material which prevents any interference from un-bound (excess) dye on the NTA measurements.
Some molecules only exhibit fluorescence after being modified by enzyme activity. Other fluorophores like Enhanced Green Fluorescence Protein (EGFPs) can be expressed by genetically modified cells and then be detected in vesicles released by the cells. For some applications it is appropriate to exploit the FRET (Fluorescence Resonance Energy Transfer) phenomenon. Here 2 fluorescent dyes are used with the emission profile of a “donor” partner overlapping the excitation profile of an “acceptor” partner. This can be especially useful when the application wants to measure if two partner particles are bound (or in close proximity). This has the added advantage of proving a larger Stokes Shift (see below).
Organic fluorophores are small molecule synthetic organic dyes that can be conjugated to other molecules like antibody or proteins without changing their properties. Alternatively, their chemical properties mean that they have an intrinsic affinity for a particular environment, lipophilic dyes for example. They are available in variety of properties for their absorption and emission spectra as well as photostability and solubility.
Quantum dots (QDots) are semiconductor metal particles in the nanometer scale. Historically, the size of the quantum dot conferred the optical properties, however more recent commercially available variants maintain their size (typically 5 to 8nm in diameter) whilst changing optical properties. These semiconductors can emit light across the whole spectrum. In comparison to organic fluorophores they benefit from large stoke shift, superior brightness and photostability. They are most efficient when excited with a short wavelength (405nm for NTA).
There are a number of parameters that describe the characteristics of fluorescence.
Extinction coefficient - indicates quantity of light absorbed by a fluorophore at a given wavelength
Quantum yield – indicates number of emitted photons per absorbed photons (upcoming energy). The higher Quantum yield the brighter the fluorophore will be.
Difference maximum excitation and emission wavelengths. The larger the Stokes shift is, along with a minimum absorption and emission spectra overlap, the more applicable is the fluorophore for use with NanoSight and greater the chance for detection of emitted fluorescence signal.
The excitation maximum of the fluorophore should be close to the wavelength of the laser (excitation source) fitted to the instrument
The emission maximum of the fluorophore should be longer than the wavelength cut-off point of the filter fitted to the instrument (see Table 1)
Fluorophores with a large Stokes shift (wavelength between the excitation and emission maxima of the fluorophore) will give better results
Bright and photostable fluorescence emission result in clearer and stronger fluorescence signal
Available Laser Wavelengths (nm) | Standard Filter Supplied (nm) |
Violet 405 | 430 long pass |
Blue 488 | 500 long pass |
Green 532 | 565 long pass |
Fluorescence detection using red 642nm laser is also possible but please talk to your local Malvern representative for more information.
Photobleaching occurs when a fluorophore permanently loses the ability to fluoresce due to photon-induced chemical damage or covalent modification. Some fluorescent dyes are more photostable than others, with metal semi-conductor fluorophores being the most stable. The way in which the fluorophore is incorporated into the particle can also influence susceptibility to photobleaching. Photobleaching can result in a dramatic loss in the fluorescence emission intensity, and a subsequent reduction in the ability to perform accurate sample analysis with the NanoSight system.
Using a synchronization cable and syringe pump can significantly reduce the impact of photobleaching during sample analysis, and further increase the accuracy of particle concentration measurement and sizing when operating in fluorescence mode.
The synchronization cable, which is fitted to all high sensitivity systems, is used to pulse the laser in synchrony with the camera shutter, thus limiting the overall exposure time of the fluorophore to the illumination source, thereby slowing down the process of photobleaching.
The syringe pump further improves the accuracy of fluorescence measurements by enabling a constant supply of new, non-illuminated sample to be flowed through the sample chamber at a speed faster than the bleach rate of the fluorophore. Malvern Instruments recommends the use of the syringe pump for all fluorescence measurements.
The table 2 below shows some examples of fluorophores successfully used with NanoSight system across various application area.
Excitation wavelength (nm) | Fluorophore | Sample type | Comments |
405 | QDots 565* | Exosomes Microvesicles | Specific 2-step labelling biotinylated Antibody (Ab)-streptavidin link |
QDots 585* | Exosomes Microvesicles | Specific 2-step labelling biotinylated Ab-streptavidin link | |
QDots 605* | Exosomes Microvesicles | Direct Ab labelling | |
Coumarin6 | Drug delivery (polymeric) | PLA particles containing Coumarin 6 -conjugated drug molecules | |
488 | Alexa 488 | Exosomes, Microvesicles | Direct Ab labelling of surface partner molecule |
Atto 488 | Lipids | Direct Ab labelling | |
NL493 | Gold | Biotinylated gold-streptavidin-NL493 labelling system | |
EGFP | Exosomes, Microvesicles | Exosomes from EGFP-expressing cell line | |
PKH67 | Exosomes, Microvesicles | Lipophilic dye labelling exosomes and microvesicles (physiological) | |
DiO | Liposomes | Lipophilic dye (physiological) | |
532 | Sypro Red | Virus | General Protein dye (physiological) |
Rhodamine-PE | Exosomes | Direct Ab labelling of surface partner molecule | |
Nile Red | Lipids | Only fluorescent in nonpolar environment (physiological) | |
DiI | Lipids, Exosomes | Lipophilic dye (physiological) | |
PKH26 | Exosomes, Liposomes | Lipophilic dye (physiological) | |
Cell mask Orange | Exosomes, Microvesicles | Lipophilic dye labelling exosomes and microvesicles (physiological) | |
642 | Atto 633 | Lipids | Used as an acceptor in FRET pair |
Alexa 647 | Exosomes, Microvesicles | Direct Ab labelling of surface partner molecule |
*Quantum dots can also be excited by 488 nm laser, however the fluorescence signal will be brighter when using the 405 nm laser.
It is better to label particles at a high concentration and then dilute after labeling (immediately prior to analysis):
This will enable dilution of the sample down to the optimal concentration range for NanoSight and may also help to dilute any unbound fluorescent label that is in the sample.
It also increases the likelihood (rate) of interaction between fluorophore and target.
To achieve optimum signal to noise ratio, try varying the concentration of fluorescent label to sample particles:
If using primary and secondary antibodies rather than directly labeling, you will need to try varying the ratios of these too.
Adding large quantities of fluorescent label will not necessarily result in better labeling:
Unbound label free in solution can become a problem, raising the background intensity and masking the signal from labeled particles.
Large excess of fluorescent label can result in quenching of the fluorescent signal.
Reducing the amount of organic solvent in a labeling volume of aqueous sample decreases the risk of sample aggregation.
Where reagents have not been obtained from commercial sources, it is best practice to check functionality of reagents with orthogonal techniques before starting the labeling process for NanoSight measurements.
The incubation buffer, time, volume, temperature etc. should be optimized for individual fluorophores and the sample under investigation. A staining protocol that works for other techniques e.g. flow cytometry or fluorescent microscopy, is likely to require further assay development to give a suitable labeling level for use with NanoSight.
Prior to carrying out a fluorescence measurement it is necessary to dilute the sample to an optimum concentration for NanoSight. Prepare a range of sample dilutions, for example: 10x, 100x, 1000x, 10,000x. This should first be checked in normal scatter mode, by loading the most dilute sample into the chamber and then gradually loading in more concentrated sample until you reach the optimum concentration for analysis.
Once an optimum dilution for measurement in scatter mode has been determined, the sample can be checked in fluorescence mode. If no signal is seen, continue to inject sample at a higher concentration until fluorescent particles become visible. It is not uncommon to run fluorescence measurements at a much higher concentration than scatter measurements, especially when optimizing the labeling protocol.
For an LM10 system - Check that the synchronization cable is connected from the camera to either the laser (LM12 unit), or to the back of the control box (LM14 unit).
It’s strongly recommended to use the syringe pump for all fluorescent samples to reduce photobleaching. To operate syringe pump, open the syringe pump control, connect the syringe pump and flow the sample at the speed in which particles cross field of view within 5-10 seconds. All measurements using the syringe pump should be carried out in scatter and fluorescence mode at the same flow speed for comparison of results.
To protect sample from the direct light exposure store the sample in non-transparent sample container (or wrapped in aluminium foil) and wrap the syringe (and tubing) in aluminium foil.
1. Identify correct image position under the light scatter mode
2. Make sure the sample is flowing under the recommended flow rate (particles cross the field of view within 5-10 seconds)
3. Increase camera level to maximum setting
4. Insert the fluorescence filter to change to fluorescence mode:
LM10 instrument - insert silver lever on right hand side of microscope optical head to put the fluorescence filter in (Image 1). The filter will be on the right hand side. Where two filters have been fitted, one filter will be on the left hand side, below the lever which switches between the microscope oculars and the camera. Note, there will be a colored dot next to the lever indicating that a filter has been fitted.
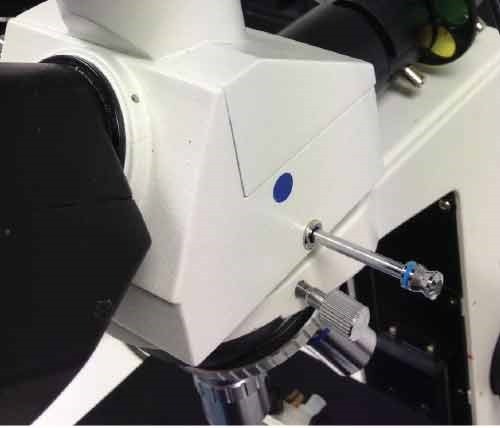
Image 1. LM10 filter position. The fluorescence filter is fitted on the right hand side of the microscope optical head (see red arrow). The colored dot indicates that the filter has been fitted. To insert the fluorescence filter, the silver lever must be pushed in. If a second filter has been fitted this can be inserted by using the lever on the left hand side.
NS300 instrument - under the Hardware camera menu item, select the relevant filter position for your system.
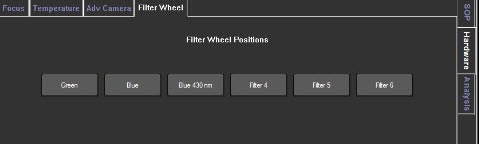
Image 2. Selection of the fluorescence filter in the NS300 is achieved by selecting the correct filter location in the software. These are found under the Hardware>Filter Wheel tab, as shown for NTA software version 3.0 and above.
NS500 instrument - first check the position of the fluorescence filter in the filter holder, it will be indicated by a colored dot. Either push in or pull out the filter holder until it clicks into position - the direction of movement will depend on the position of the filter in the holder (Image 3).
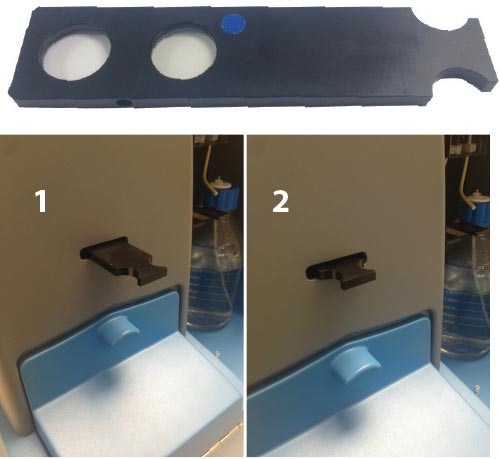
Image 3. (Top) The NS500 filter holder. The colored dot shows the position of the fluorescence filter. (Bottom) Position 1 - the clear glass filter is inserted - this position should be used for light scatter mode. Position 2 - the fluorescence filter is inserted - this position should be used for fluorescence mode. These positions are correct if the fluorescence filter is fitted as shown in the top image.
5. In fluorescence mode refocus to see particles:
· LM10 instrument - manually turn fine focus ~1/4 of a turn clockwise
· NS300 and NS500 instruments - adjust focus from within the software, Image 4.
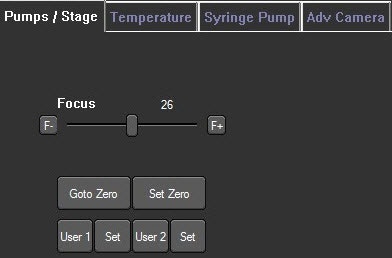
Image 4. Camera focus control is found within the software under the Hardware> Pumps/Stage tab. Click the F- and F+ buttons to incrementally adjust the focus or use the slider bar for larger focus steps.
6. Further adjust the camera level - it is often necessary when working with fluorescent samples that are very dim (relative compared to the image background) to adjust the Advanced Camera grey scale histogram settings, to further increase the brightness of the particles relative to the background (optimize contrast) (see Image 5)
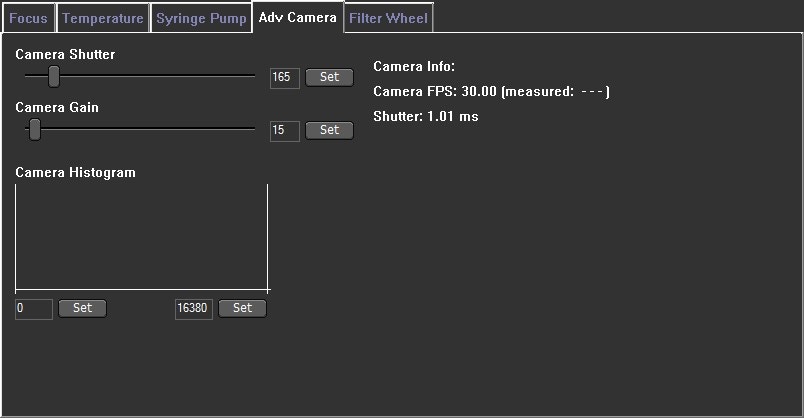
Image 5. Camera grey scale histogram which is found within the software under the Hardware> Adv Camera tab. The optimal threshold range is achieved by setting the minimum value to a level which allows the dimmest particles to still be visualized: move the grey cursor (blue arrow - left side) into position with the left-hand mouse button. Move the maximum to a level at which the largest particles do not contain many saturated pixels: move the other grey cursor (red arrow - right side) into its maximum position using the right-hand mouse button.
7. Collect the data under the fluorescence mode first to minimize sample exposure to the light and to not exceed the incubation time (minimum of 5 repeats of 60 - 90 second capture duration are recommended)
8. Measure the sample in light scatter mode by manually removing the filter (LM10 and NS500 instruments) or within the software (NS300 instruments). Keep the same flow condition, number of repeats etc.
9. Compare results from both modes (by overlaying size distributions) and calculate the labeling efficiency (by comparing the concentration values), Image 6.
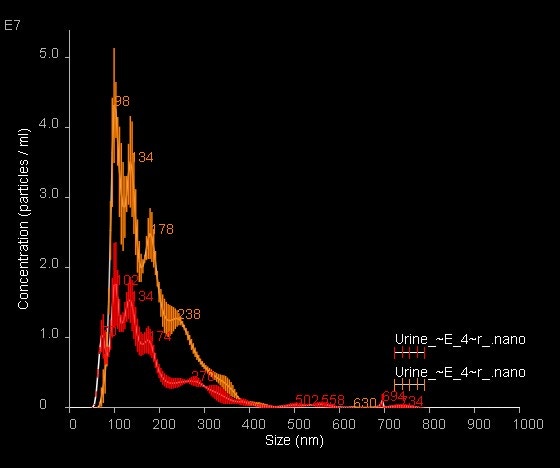
Image 6. Overlay of NanoSight Size-Distribution data for fluorescently labeled urinary exosomes; light scatter data are shown in orange with fluorescence data shown in red. Data are mean ± SEM
10. Compare the size profile distribution with unlabeled sample.
Misinterpretation of results is common with fluorescence measurements. To ensure correct conclusions are drawn it is necessary to run several controls, depending on the labeling method used. All preparation steps should be checked in both scatter and fluorescence mode to enable the user to best understand the results (see Table 3 and 4).
Sample | Scatter Mode | Fluorescence Mode |
Sample diluent* alone | Check for particles & filter if necessary/possible | Check for fluorescence either as individual particles or a background haze brighter than water alone |
Unlabeled sample in diluent | Check particle size and concentration for comparison with labelled sample data | Check that sample does not auto-fluoresce |
Fluorescent reagent in diluent**, ***,¶ | Check that there are no large particles/aggregates seen & filter if necessary/possible | Check fluorescence is seen as a flickering background haze, but no large particles seen that could be mistaken for labelled sample particles |
Isotype control | Check particle size and concentration - should be the same as sample alone | Check fluorescence is seen as a flickering background haze, but particles of interest are not labelled |
Labeled sample in diluent | Compare particle size and concentration of unlabeled sample data and labeled sample fluorescence data | Check particle size and concentration for comparison with scatter |
Sample | Scatter Mode | Fluorescence Mode |
Sample diluent* alone | Check for particles & filter if necessary/possible | Check for fluorescence either as individual particles or a background haze |
Unlabeled sample in diluent | Check particle size and concentration for comparison with labelled sample data | Check that sample does not fluoresce, and that there is no bleed of scatter through the filter (from very high intensity particles) |
Primary reagent in diluent** | Check that there are no large particles/aggregates seen & filter if necessary/possible | Check no fluorescence is seen |
Secondary (fluorescent) reagent in diluent**, ***, | Check that there are no large particles/aggregates seen & filter if necessary/possible | Check fluorescence is seen as a flickering background haze, but no large particles that could be mistaken for labelled sample particles |
Primary + secondary reagent in diluent**, ***, | Check that there are no large particles/aggregates seen & filter if necessary/possible | Check fluorescence is seen as a flickering background haze, but no large particles that could be mistaken for labelled sample particles |
Sample + primary reagent** | Check particle size and concentration - should be the same as sample alone | Check no fluorescence is seen |
Isotype control | Check particle size and concentration - should be the same as sample alone | Check fluorescence is seen as a flickering background haze, but particles of interest are not labeled |
Labeled sample in diluent | Check particle size and concentration for comparison with unlabeled sample data and labeled sample fluorescence data | Check particle size and concentration for comparison with scatter |
Outlined below are possible items you may encounter during assay development and their common solutions.
Problem | Possible cause | Solution |
No fluorescence signal | Incorrect filter or filter set up | Make sure the correct fluorescent filter is applied and the filter is fully inserted |
Incorrect laser wavelength | Make sure the correct excitation wavelength is used | |
Capture settings | Use the highest camera level and adjust camera histogram to detect much weaker fluorescent signal | |
Photobleaching | Use syringe pump to detect and measure sample under the flow conditions at all times | |
For fast bleaching fluorophores slightly increase flow speed. Note: higher than recommended flow rate can affect the end size results | ||
Labelling conditions | Increase fluorescent probe concentration | |
Increase incubation time | ||
Weak fluorescent signal | Labelling conditions | Optimize labelling procedure by titrating the fluorescent probe to target particles and finding the best labelling conditions |
Optimize incubation time for labelling procedure | ||
Increase concentration of fluorescent reagent to multiply(strengthen) fluorescence signal from a single particle | ||
Reduce concentration of fluorescent probe to decrease its excess | ||
Fluorescent probe properties | Check the fluorescent probe properties for brightness and photostability and try brighter or more photostable reagent | |
Capture settings | Adjust camera histogram for better detection of weakly fluorescent particles | |
High background noise | Fluorophore excess | Decrease fluorescent probe concentration in labelling procedure |
If possible, remove excess of fluorescent probe | ||
Non-specific background and Autofluorescence | Use a custom band-pass filter to remove unwanted fluorescent emission and only allow through the emission from the fluorescent label | |
Use another laser wavelength which does not cause auto-fluorescence in the sample preparation, and change the fluorophore to suit. | ||
Signal from diluent | Non-specific background and Autofluorescence | Use a custom band-pass filter that will cut off the unwanted fluorescent emission and only allow through the emission from the fluorescent label |
Use another laser wavelength which does not cause auto-fluorescence in the sample preparation, and change the fluorophore to suit. | ||
If possible, filter out the biggest particles/aggregates | ||
Signal from fluorescent probe | Particles and aggregates present in fluorescent probe | Filter the fluorescent probe/antibody solution with 20 nm filter prior to labelling |
Make sure the fluorescent probe is fresh and stored in recommended conditions | ||
Size distribution changes | Size distribution different to unlabelled sample | If changes are minimal <20nm and the whole size distribution profile is Shifted towards bigger sizes: Usually indicates high labelling efficiency |
Check the fluorescent probe alone for the presence of very small fluorophore aggregates | ||
Use higher Detection threshold to reduce noise tracking | ||
Sample aggregation | Reduce the amount of a fluorescent probe as its high concentration could initiate the aggregation | |
Reduce the amount of the organic solvent in the labelling volume as this can influence sample stability | ||
Shorten the incubation time | ||
Scatter and fluorescence size distributions | Check if fluorescent probe reacts with your sample particles (e.g. initiate protein aggregation) | |
Check the fluorescent probe alone and after conjugation for the presence of very small fluorophore aggregates | ||
Find out the size of the fluorescent probe molecules. E.g. Qdots can be detected by NTA system |
Choose a method of labeling that is suited to the particles being studied.
Choose an appropriate fluorophore for use with NanoSight:
It is very important to match the excitation and emission characteristics of the fluorophore to the configuration of the NanoSight instrument that is being used.
Bright and photostable fluorophores work best.
Use the synchronization cable and syringe pump to address the problem of fluorophore photobleaching.
Optimize the labeling procedure until the best signal to noise ratio is achieved:
Vary the ratio of fluorescent probe/antibody to sample.
Find an optimum incubation time of the sample with fluorescent probe.
Label the sample at high concentration and dilute after incubation.
Protect the fluorescent probe from a direct light
Dilute the sample to an optimum concentration for NanoSight in scatter mode before trying to analyze in fluorescence mode.
If necessary, increase the concentration of sample for fluorescence analysis.
Increase the camera level in fluorescence mode and adjust focus to see fluorescent particles clearly:
If needed, further adjust the camera grey scale histogram to better detect fluorescence signal
If using the syringe pump, carry out both scatter and fluorescence measurements under the same flow rate.
Ensure all necessary controls are analyzed to prevent misinterpretation of results and aid troubleshooting.