Titanium dioxide is used in food as a pigment, imparting a white color to food such as powdered donuts, candy and frosting. The International Agency for Research on Cancer (IARC from World Health Organization, WHO) characterized TiO 2 as potentially carcinogenic to human beings. Recent data indicates that TiO2 nanoparticles are cyto and genotoxic against several lineages of cell cultures. They also present high carcinogenic potential in animal models.12,13 It is a controversial subject that extensively attracts the attention of the scientific community. Consequently, the developments of fast and robust methods for TiO2 analytical determinations are welcome.
Please login or register to read more.
Titanium dioxide is used in food as a pigment, imparting a white color to food such as powdered donuts, candy and frosting. The International Agency for Research on Cancer (IARC from World Health Organization, WHO) characterized TiO 2 as potentially carcinogenic to human beings. Recent data indicates that TiO2 nanoparticles are cyto and genotoxic against several lineages of cell cultures. They also present high carcinogenic potential in animal models. It is a controversial subject that extensively attracts the attention of the scientific community. Consequently, the developments of fast and robust methods for TiO2 analytical determinations are welcome.
In 2016 the Food and Drug Administration (FDA) in the US set guidelines for limits of titanium dioxide in food. Chapter 21CFR73.575 states “the color additive titanium dioxide may be safely used for coloring foods generally, subject to the following restrictions: the quantity of titanium dioxide does not exceed 1 percent by weight of the food.”

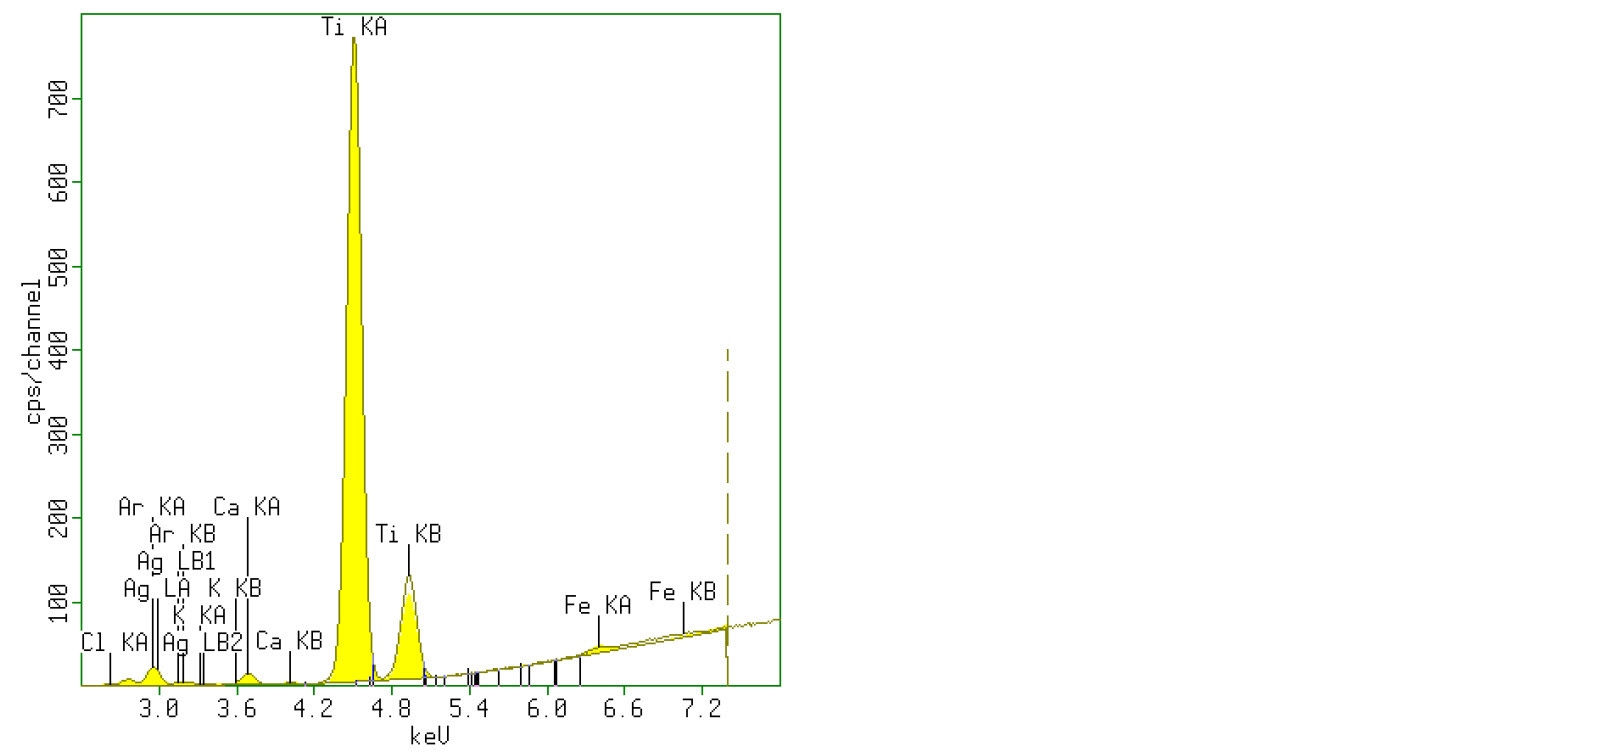
Figure 1. XRF spectrum of 1% titanium dioxide in sugar
Measurements were performed using an Epsilon 1 EDXRF spectrometer, equipped with a 50 kV silver anode X ray tube, six filters, and high-resolution silicon drift detector. The data were automatically processed by the Epsilon 1 software.
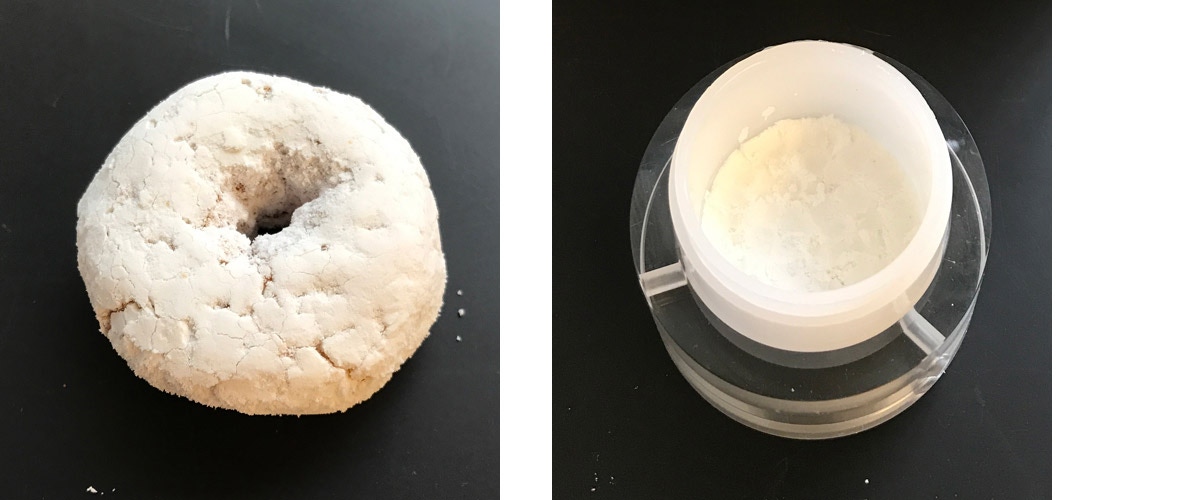
Calibration standards were created by weighing commercial food and pharmaceutical grade titanium dioxide and pure cane sugar, grinding with a ball mill, then pouring the loose powder into a measurement cup. A test sample was created by scraping the powdered sugar coating off a donut and placing in a measurement cup (Figure 3).

Figure 2. powdered donut sample (left) & Figure 3. powdered sugar sample (right)
The measurement condition that was used is seen in Table 1. One condition was used to optimize the excitation of the element Titanium. The total measurement time was 1 minute per sample.
| Condition | kV | uA | Filter | Meas. Time (s) | Elements |
|---|---|---|---|---|---|
| <K-V> | 12 | 416 | Al-50 | 60 | Ti |
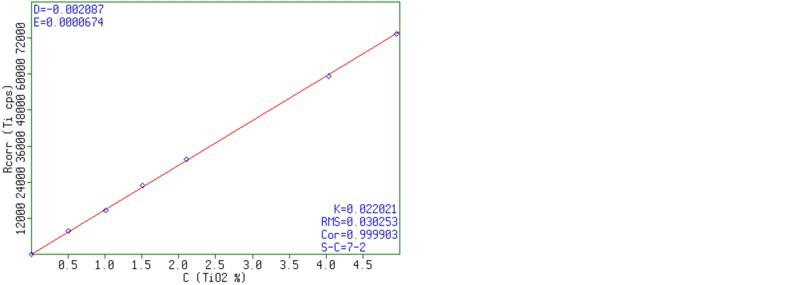
Figure 4 shows the calibration curves for Ti in sugar. The graphs show a good correlation between the calculated concentrations and the measured intensities.

Figure 4. Calibration curve for Ti in sugar
To test the instrument precision, a sample of the powdered sugar from a donut was measured 20 times consecutively using the same measurement time as the calibration samples. The average concentrations and standard deviations for the element Ti are shown in Table 2. This data reflects the high precision of the Epsilon 1 system.
| Nr | Ident | C (TiO2%) | |
|---|---|---|---|
| 1 | LDP1 | 2.29 | |
| 2 | LDP1 | 2.28 | |
| 3 | LDP1 | 2.28 | |
| 4 | LDP1 | 2.28 | |
| 5 | LDP1 | 2.28 | |
| 6 | LDP1 | 2.28 | |
| 7 | LDP1 | 2.28 | |
| 8 | LDP1 | 2.28 | |
| 9 | LDP1 | 2.28 | |
| 10 | LDP1 | 2.28 | |
| 11 | LDP1 | 2.28 | |
| 12 | LDP1 | 2.28 | |
| 13 | LDP1 | 2.28 | |
| 14 | LDP1 | 2.28 | |
| 15 | LDP1 | 2.28 | |
| 16 | LDP1 | 2.28 | |
| 17 | LDP1 | 2.28 | |
| 18 | LDP1 | 2.28 | |
| 19 | LDP1 | 2.28 | |
| 20 | LDP1 | 2.28 | |
| Ave of 20 | 2.28 | % | |
| 1SDev of 20 | 0.004 | % | |
| 2SDev of 20 | 0.008 | % | |
| Range | 0.010 |
The sample powdered sugar from a donut was found to contain 2.32% titanium dioxide. When considering the entire weight of the donut and the weight of powdered sugar removed, it was calculated that titanium dioxide comprised 0.14% of the total donut, well within the FDA guideline 21CFR73.575.
| Weight | Unit | Conc. | Unit | |||
|---|---|---|---|---|---|---|
| Weight of one donut | 13.90 | gms | LD Mini Powdered Donuts | |||
| Weight after sugar removed | 13.09 | gms | Compound | |||
| Weight of sugar | 0.81 | gms | Ti02 | |||
| Note: not all sugar could be removed | ||||||
| Six donuts were used to collect the sugar | Total Ti02 content in one donut from sugar | 0.019 | gms | |||
| Weight of sugar in sample cup | 4.05 | gms | Percentage in a single donut | 0.14 | % |
The results demonstrate the excellent capability of Epsilon 1 for screening for the presence of titanium dioxide in food. The high resolution and sensitivity of the silicon drift detector combined with powerful software make it possible to rapidly detect and quantify Ti in one minute per sample.
Malvern Panalytical would like to thank Dr. Lili He and graduate student Kevin Zhang Of University of Massachusetts Amherst Department of Food Science for their collaboration on this project.