This application note demonstrates the performance of the Axios FAST XRF spectrometer in providing accurate and precise iron ore analyses.
Accurate elemental analysis of iron ore samples plays a very important role in iron ore mine mapping and iron ore pricing. XRF analysis provides a useful tool for classifying and controlling the quality of the iron ore composition.
Iron ore is mainly used as a raw material in the steel and cement industries. Accurate elemental analysis of iron ore samples plays a very important role in iron ore mine mapping and iron ore pricing. XRF analysis provides a useful tool for classifying and controlling the quality of the iron ore composition.
The Axios FAST is ideally suited for many applications, where speed and accuracy are factors of prime importance. This application note demonstrates the performance of the Axios FAST XRF spectrometer in providing accurate and precise iron ore analyses.
A series of 19 commercially available certified reference materials, BCS 176-2 BCS 301, BS 104, ECISS 606-1, ECSC 627-2, ECSC 630-1, ECSC 631-1, ECSC 676-1, ECSC 677-1, ECSC 678-1, ECSC 681-1, ECSC 683-1, ECSC 686-1, EGKS 679-1, IPT 21, JSS 803-3, JSS 830-3, JSS 850-3 and JSS 852-1, were used to derive accuracies and lower limits of detection for a number of major, minor and trace elements.
Measurements were performed using a PANalytical Axios FAST simultaneous wavelength dispersive X-ray fluorescence spectrometer equipped with a 4 kW Rh SST-mAX X-ray tube, set at 60 kV / 66 mA for optimal measurement conditions. In addition, the Axios FAST was equipped with:
- Rh reference plate with 27 mm opening
- Fixed channels for Na, Mg, Al, Si, P, S, K, Ca, Ti, V, Cr, Mn, Fe, Ni, Cu and Zn
40 mm fused beads of iron ore were prepared with the Eagon 2. The following recipe was used:
(dilution 1:10)
Spectroflux 161A = Flux 12/22
Composition of flux: 45% lithium tetraborate + 45% lithium metaborate + 10% LiNO3
Preparation:
Flux 161A: (9.7646 +/- 0.0005) g
Fe ore sample: (0.9000 +/- 0.0005) g
Releasing agent: ~ 30 mg tablet
Total preparation time was ~ 30 minutes per sample.
| Program name | Iron ore | |||
| Pre-treatment | Yes | |||
| #1 | time, s | 600 | temp., °C | 720 |
| Melting | time, s | 120 | temp., °C | 1100 |
| Mixing | time, s | 540 | angle, ° | 45 |
| temp., °C | time, s | speed, % | 60 | |
| Injecting | time, s | 60 | ||
| Pouring | time, s | 15 | angle, ° | 135 |
| Cooling | delay, s | 25 | ||
| #1 | time, s | 60 | speed | 20 |
| #2 | time, s | 120 | speed | 100 |
An application was created to measure the X-ray intensities for Na2O, MgO, Al2O3, SiO2, P2O5, SO3, K2O, CaO, TiO2, Cr2O3, V2O5, Mn3O4, Fe2O3, NiO, CuO and ZnO in 19 iron ore fused bead standards.
All measurements were done on the peak only. The X-ray intensities for the 16 compounds were measured simultaneously. The measurement time for each compound was 200 s, except for Fe2O3 where the measurement time was determined to reach a counting statistical error of 0.016% relative. For the precision and reproducibility tests, the measurement time for Fe was fixed at 320 s.
A calibration curve for each compound was set up using the regression model incorporated in the SuperQ software package, taking into account corrections for interelement effects and line overlaps.
Calibration curves for SiO2, P2O5 and Fe2O3 in iron ore fused beads are shown in Figures 1, 2 and 3, respectively, and calibration details for all compounds are given in Table 1. The accuracy of the calibrations are indicated by RMS (absolute error) and K (relative error). Since the K- value is independent of the calibrated concentration range (unlike the RMS value) it gives a more reliable indication of the calibration quality. As a general rule K-factors < 0.05 indicate accurate calibration. The lower limits of detection (LLD) are shown in Table 1. They are calculated based on the measurement time of 100 s.
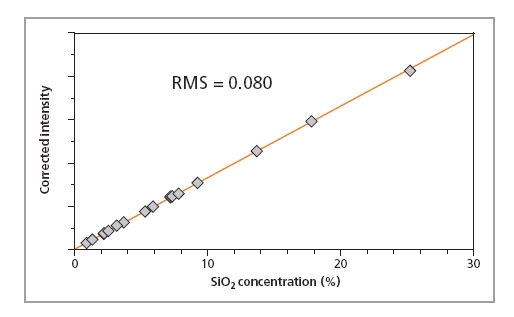
Figure 1. Calibration plot for SiO2 in iron ore samples prepared as fused beads
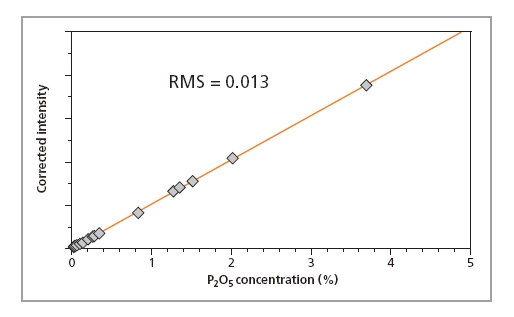
Figure 2.
Calibration plot
for P2O5 in iron ore
samples prepared
as fused beads
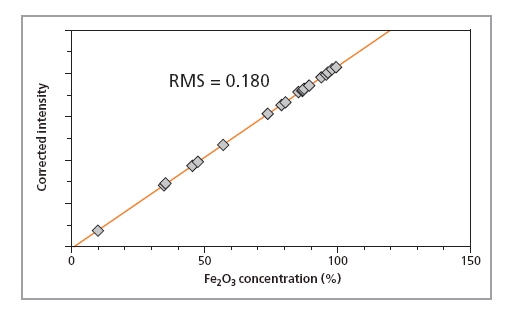
Figure
3. Calibration
plot for Fe2O3 in iron
ore samples prepared
as fused beads
| Compound | Concentration range (wt%) | K-value | RMS (wt%) | LLD 100 s (ppm) |
|---|---|---|---|---|
| Na2O | 0.003 – 0.2 | 0.057 | 0.008 | 52.9 |
| MgO | 0.0045 – 3.45 | 0.057 | 0.050 | 40.1 |
| Al2O3 | 0.08 – 10.6 | 0.026 | 0.038 | 7.1 |
| SiO2 | 0.02 – 25.2 | 0.025 | 0.081 | 10.2 |
| P2O5 | 0.02 – 3.7 | 0.013 | 0.013 | 2.0 |
| SO3 | 0.007 – 1.2 | 0.010 | 0.006 | 6.2 |
| K2O | 0.002 – 1.3 | 0.010 | 0.006 | 4.9 |
| CaO | 0.014 – 25.3 | 0.030 | 0.067
|
6.7 |
| TiO2 | 0.002 – 6.33 | 0.015 | 0.009
|
12.1 |
| Cr2O3 | 0.003 – 0.06 | 0.007 | 0.002
|
4.4 |
| V2O5 | 0.005 – 0.93 | 0.010 | 0.005
|
7.8 |
| Mn3O4 | 0.01 – 65.9 | 0.037 | 0.046 | 4.7 |
| Fe2O3 | 9.8 – 99.3 | 0.022 | 0.179 | - |
| NiO | 0.008 – 0.06 | 0.015 | 0.005
|
3.9 |
| CuO | 0.005 – 0.02 | 0.012 | 0.004 | 3.0 |
| ZnO | 0.0005 – 0.09 | 0.028 | 0.011 | 2.6 |
To test the precision of the method and the instrument, one iron ore fused bead sample was measured twenty times consecutively. The average concentration, the absolute RMS error (1 sigma) and relative RMS of the repeated measurements are presented in Table 2. For comparison, the counting statistical errors (CSE, the theoretical minimum possible error) are also shown in Table 2. The CSEs are expressed in concentration units. Comparison of these precision measurements with the CSE emphasizes the inherent stability of the Axios FAST instrument.
| Result type (%) | Avarage conc. (wt%) | RMS (wt%) | Rel RMS (%) | CSE (wt%) |
|---|---|---|---|---|
| Al2O3 | 3.78 | 0.005 | 0.13 | 0.004 |
| CaO | 6.13 | 0.003 | 0.05 | 0.003 |
| Fe2O3 | 70.88 | 0.025 | 0.04 | 0.011 |
| MgO | 0.22 | 0.003 | 1.27 | 0.002 |
| Mn3O4 | 0.066 | 0.0003 | 0.40 | 0.0002 |
| P2O5 | 0.091 | 0.0003 | 0.35 | 0.0004 |
| SiO2 | 7.295 | 0.005 | 0.06 | 0.004 |
| SO3 | 0.046 | 0.0004 | 0.92 | 0.0004 |
| TiO2 | 0.302 | 0.0008 | 0.26 | 0.0008 |
| K2O | 0.089 | 0.0002 | 0.27 | 0.0004 |
| Na2O | 0.012 | 0.003
|
20.9 | 0.002 |
| Cr2O3 | 0.006 | 0.0002 | 3.45 | 0.0002
|
| V2O5 | 0.013 | 0.0004 | 2.82 | 0.0003 |
| ZnO | 0.014 | 0.0001 | 0.99 | 0.0001 |
| CuO | n.d. | n.d. | n.d. | n.d. |
| NiO | 0.001 | 0.0002 | 13.4 | 0.0001 |
Additionally, the fused bead sample preparation using the Eagon 2 was tested. Table 3 shows the average concentrations, the absolute RMS (1 sigma) and the relative RMS for 20 fused bead replicates of an iron ore sample made with the Eagon 2. Considering that the standard deviation value includes not only sample preparation errors but also instrumental measurement errors, it can be seen that the Eagon 2 produces highly reproducible beads.
| Result type (%) | Avarage conc. (WT%) | RMS (wt%) | Rel RMS (%) |
|---|---|---|---|
| Al2O3 | 3.77 | 0.008 | 0.20 |
| CaO | 6.12 | 0.018 | 0.29 |
| Fe2O3 | 70.79 | 0.106 | 0.15 |
| MgO | 0.23 | 0.007 | 2.9 |
| Mn3O4 | 0.066 | 0.0002 | 0.34 |
| P2O5 | 0.09 | 0.0003 | 0.34 |
| SiO2 | 7.27 | 0.012 | 0.17
|
| SO3 | 0.046 | 0.0006 | 1.3 |
| TiO2 | 0.30 | 0.002 | 0.73 |
| K2O | 0.088 | 0.0004 | 0.40 |
| Na2O
|
0.016 | 0.003 | 20.2 |
| Cr2O3 | 0.006 | 0.0002 | 3.1 |
| V2O5 | 0.013 | 0.0003 | 2.1 |
| ZnO | 0.014 | 0.0002 | 1.3 |
| CuO | n.d. | n.d. | n.d. |
| NiO | 0.001 | 0.0002 | 14.0 |
Elemental analysis with an Axios FAST XRF spectrometer is key to the control of quality and production processes in the mining of iron ore deposits. It has been demonstrated that analyses are accurate and precise and the method benefits from the simple fusion sample preparation with Eagon 2. Performance, operator safety and ease of use are central to Eagon 2, making fusion and the consequent benefit of accurate XRF analysis easily achievable. Furthermore, the stability of the system is such that individual calibrations can be used over prolonged time using only simple drift correction procedures, producing highly consistent data over time.