
Work performed in conjunction with the Institut Pasteur, Paris, France
The ability of small, highly charged cations to induce protein structural changes following binding is a fundamental process behind many biological signaling pathways. Whilst the signaling cascades controlled by cation binding are very diverse, individual cation-binding motifs are often conserved between different proteins. One such cation binding motif is the "Repeat in Toxin" (RTX) motif present on many virulence factors that is secreted by pathogenic microbes. RTX sequences are glycine- and aspartate-rich domains that constitute a specific type of Ca2+ binding site that is essential for the function of such secreted toxins, including the pore-forming cytolytic toxin, adenylate cyclase toxin (CyaA). Indeed, CyaA, from Bordetella pertussis, the causative agent of whooping cough, has been shown to bind calcium in solution. The calcium dependence of these secreted toxins has been proposed to facilitate their secretion into the extracellular medium, as newly synthesized peptides would need to pass through the narrow channels of the secretion machinery. With the low calcium concentration inside the bacterial cytosol, it has been suggested that RTX motifs would form an unfolded conformation, favorable for secretion. However, once in the extracellular space, the higher calcium concentration would cause the RTX domain to bind calcium ions, and form a structured, active protein. In order to better characterize the mechanism of calcium-dependent RTX function, a series of biophysical methods were employed to study changes in both conformation and size of the RTX repeat domain (RD) of CyaA toxin, following calcium binding.
Intrinsic Viscosity and Molecular Mass Measurements with SEC-TD - Size exclusion chromatography (SEC) experiments were performed using a Superdex 200 column (GE Healthcare) controlled by a GPCmax module and connected on-line to a triple detector array (TDA) model 302 (Malvern, UK). TDA contained (i) a static light scattering cell with two photodiode detectors, at 7° for low angle (LALS) and at 90° for right angle laser light scattering (RALS), (ii) a differential refractive index detector, (iii) a photometer, and (iv) a differential viscometer. Protein concentration was determined using both the photometer and the refractive index detector. The RALS and LALS data, in combination with the concentration, provided the molecular mass M. Intrinsic viscosity (η) was calculated using the differential viscometer. Both molecular mass and intrinsic viscosity were calculated with the OmniSEC software.
Zeta Potential - zeta potential and electrophoretic mobility experiments were performed using a Zetasizer Nano ZS instrument (Malvern) which monitors the forward light scattering at an angle of 17°. Buffers and samples were filtrated on 0.2 μm filters prior to acquisition. RTX polypeptide concentrations ranged between 70 to 130 μM and were diluted in 20 mM Hepes, 20 mM NaCl, pH 7.4. A dedicated cuvette DTS1070 and a high concentration microcuvette ZEN1010 were used for the acquisition of the electrophoretic mobility values using the fast field reversal mode. The quality of the instrumentation was checked using the standard DTS1235. For each sample, five to ten independent measurements (one run each) were acquired in fast field reversal mode. The quality criteria to keep a measurement were based on: (i) the zeta quality factor (signal-to-noise ratio of the frequency shift); (ii) the mean count rate that should not change throughout the duration of the data acquisition; (iii) the quality of the phase plot (radian amplitude and frequency) and the Fourier-transform of the phase plot. The acceptable electrophoretic mobility measurements were averaged and the standard deviation was computed. These data were used to generate the electrophoretic mobility distribution of each state (Apo and Holo) of RCL and RCS.
Other methods used in this study, but not described here, include Circular Dichroism (CD) and Analytical Ultracentrifugation (AUC), and Nuclear Magnetic Resonance Spectroscopy (NMR).
The changes in the protein conformation and biophysical properties of RD, following the binding of calcium were studied. In particular, the utilization of Size Exclusion Chromatography, coupled to a Triple Detector Array, yielded key information regarding the behavior of the peptide. These data are described below.
Data from Far-UV CD and NMR suggested that RD in the absence of calcium (Apo-RD) existed in a disordered state, with little structure, while RD bound to calcium (Holo-RD) formed distinct secondary structures (1). In order to further explore these differences, Apo- and Holo-RD was subjected to size exclusion chromatography (SEC), combined with a triple detector array (TDA). Holo-RD eluted at a retention volume (RV) of 13.8 mL, close to the expected RV for a globular protein of the appropriate size (Fig. 1A, B). However, Apo-RD eluted at a RV of 10.4 mL, which corresponds to a natively folded protein of approximately 600 kDa. Data from right angle light scattering intensities (Fig. 1B) indicated, however, that the molecular mass was unchanged, demonstrating the change in RV was not due to protein oligomerization. Moreover, the differential viscometer peak sizes were very different between the two states (Fig 1B), yielding intrinsic viscosity values (η) of 5.5 mL.g-1 for Holo-RD, and 35.1 mL.g-1 for Apo-RD. This unusually high value for Apo-RD explains the low RV, as RV is related to hydrodynamic volume. Supporting studies using AUC confirmed that Holo- and Apo-RD have the same molecular mass, of 73 kDa, but different sedimentation coefficients (1). These data yielded a hydrodynamic radius (RH) of 3.2 nm for Holo-RD and 6.5 nm for Apo-RD (1). Together, these data demonstrate that following binding of calcium, RD changes from a disordered peptide into a more tightly formed peptide with ordered secondary structure.
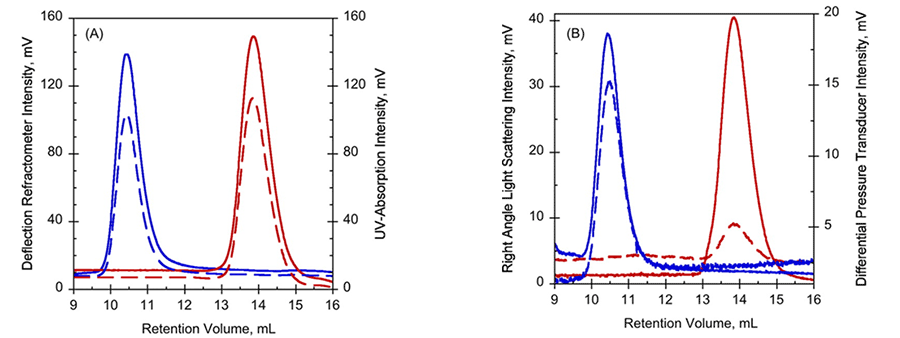
Figure 1. Hydrodynamic properties of Apo-RD (blue curves) and holo-RD (red curves). A, UV-absorption (plain curves) and deflection refractometer (dotted curves) chromatograms of apo-RD and holo-RD. B, right-angle light scattering (plain curves) and differential pressure chromatograms (dotted curves) of apo-RD and holo-RD.
The RD of CyaA is composed of approximately 40 RTX motifs, organized into five successive blocks (I-V), each separated by N-terminal and C-terminal flanking regions. In order to characterize the role these regions flanking regions play in the calcium-dependent structural changes observed, a series of peptide constructs were prepared (Fig. 2). Data from CD and tryptophan fluorescence demonstrated that the structure of domains NR and R were not altered by the presence of calcium (2). All constructs that contained the C-terminal flanking regions acquired secondary structures following the addition of calcium. Therefore, while the C-terminal regions are essential for calcium-induced formation of secondary structures, the N-terminal is not involved.
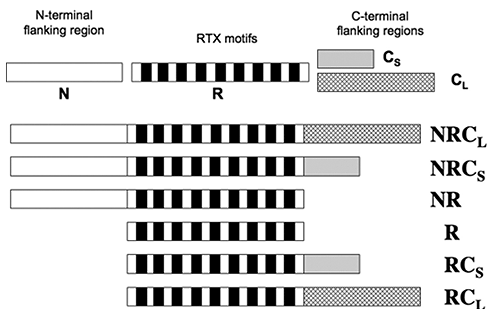
Figure 2. Schematic representation of the RTX polypeptides. The primary sequence of block V of CyaA was separated into four distinct regions: the N-terminal flanking region (N), the RTX motif regions (R), the proximal C-terminal flanking region (Cs), the long C-terminal flanking region (CL).
To further examine the calcium-induced changes to the characteristics of this domain, a calcium-sensitive (RCL) and calcium-insensitive (R) peptide were compared using SEC-TD (Fig 3). RCL exhibited changes in RV and intrinsic viscosity following calcium binding (Fig. 3A, C), suggesting a reduction in the RH. However, data from the Differential Refractometer and RALS demonstrated that the molecular mass was the same for both, and was consistent with the monomer form. In contrast to the RCL domain, the R domain did exhibit calcium dependence for any of the parameters measured (Fig. 3B, D), including RV, Differential Refractometer signal, RALS and Differential Pressure signal. Consequently, the addition of calcium did not illicit any changes in molecular mass, intrinsic viscosity or RH in the R domain, supporting the conclusion that the C-terminal is required for calcium-induced changes to the domain structure.
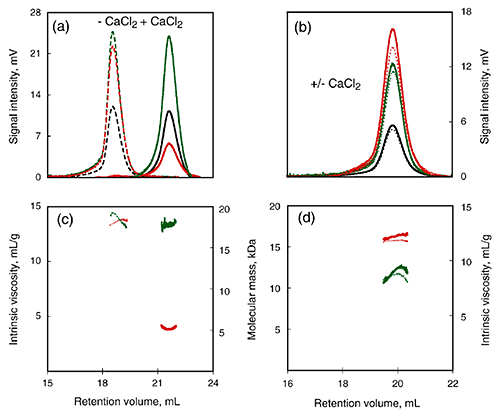
Figure 3. Hydrodynamic properties of RTX polypeptides monitored by SEC-TDA. Upper panels: RALS (green lines), differential refractometer (black lines), and differential viscometer (red lines) recordings for RCL (a) and R (b) polypeptides in the absence (dashed line) or in the presence (continuous line) of 2 mM calcium. Lower panels: The deduced molecular mass (green lines) and intrinsic viscosity (red lines) are given for RCL (c) and R (d) in the absence (dashed lines) or in the presence of calcium (continuous lines).
The RCS domain exhibited interesting traits. Data from AUC demonstrated that the RH remained unchanged following the binding of calcium, while data from CD spectroscopy detected changes in the spectra between Apo-RCS and Holo-RCS(3). To understand these apparent contradictions, the RCS domain was subjected to SEC-TD analysis. In contrast to RCL (Fig. 3A, C), RCS did not exhibit any changes in RV following binding of calcium, suggesting Apo-RCS and Holo-RCS have similar hydrodynamic volumes (Fig. 4). Data from RALS and the Differential Refractometer showed that while Apo-RCS had a molecular mass of 15.1 kDa, corresponding to the monomer, Holo-RCS had a molecular mass of 42 kDa, corresponding to the formation of a trimer. The intrinsic viscosity reduced from 14.7 to 6.4 mL.g-1, following binding of calcium. Together, these data point towards the formation of a compact trimer of RCS, following the binding of calcium.
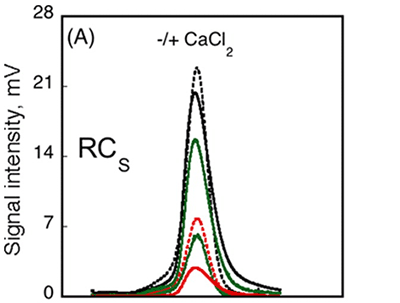
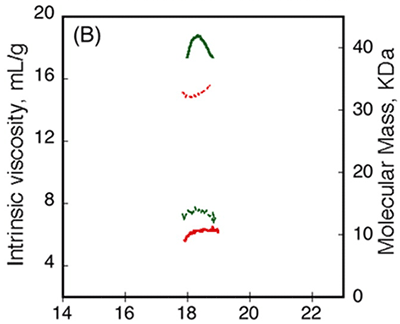
Figure 4. Hydrodynamic properties of RCS and RCL polypeptides analyzed by SEC-TD. (A) RCS polypeptide, in the absence (dashed line) or in the presence (solid line) of 5 mM CaCl2. The traces correspond to the right angle light scattering (green lines), differential refractometer (black lines), and differential viscometer (red lines). (B) The molecular mass (green lines) and intrinsic viscosity (red lines) are given in the absence (dashed lines) or in the presence of calcium (solid lines).
It has been proposed that electrostatic interactions play a critical role in the folding and stability of RTX proteins. The electrophoretic mobility and zeta potential of Apo- and Holo- forms of RCS and RCL were determined using a Zetasizer Nano ZS. These data are shown in Fig 5. The electrophoretic mobility of RCS changed from -1.35 to -0.98 µm.cm.V-1.S-1, following the binding of calcium, while RCL changed from -1.75 to -1.06 µm.cm.V-1.S-1 (Fig. 5). From these data, the number of calcium ions bound to each peptide can be inferred, as described previously (4), assuming the change in charges between the Apo and Holo states is due to the number of charges brought by the bound calcium ions. This calculation produces a value of approximately 7 calcium ions bound to RCL and approximately 5 calcium ions bound to each peptide in the RCS trimer. These data demonstrate an interesting application for zeta potential in the characterization and understanding of the interactions between charged ions and proteins.
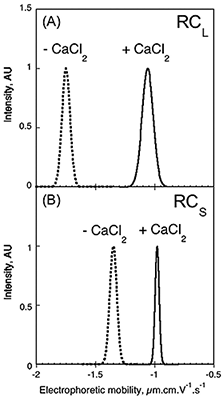
Figure 5. Electrophoretic mobility distribution of RCL and RCS. Electrophoretic mobility of RCL (A) and RCS (B) polypeptides, in the absence (dashed line) or in the presence (solid line) of 2 mM (A), 5 mM (B) CaCl2.
Understanding the conformational changes induced by cation binding is fundamental to understanding the regulation of such signaling pathways. The data documented in this application note demonstrate how a variety of biophysical methods can be employed to understand and characterize the changes in protein size, conformation and charge following the binding of calcium. The use of SEC-TD has been of great value, allowing the elucidation of size, molecular mass and intrinsic viscosity of the peptides used during this study. These data have enabled the identification of changes induced by calcium binding, as well as identification of the domains and motifs required to promote these changes. Furthermore, the use of zeta potential measurements has enabled estimation of the binding ratios of calcium ions to peptides, shedding more light onto the conformational changes induced by cation binding.
Work contained within this application note is taken from the following publications: J. Biol. Chem, (2009) Vol.284, p.1781-1789; J. Mol. Biol. (2010) Vol. 397, p.534 - 549; J. Biol. Chem. (2011) Vol. 286, p.16997 - 17004.