
In this application note, interferon α-5 was conjugated with two different PEG molecules in different reactions. The individual protein and PEG molecules, as well as the PEGylated conjugates are characterized by SEC and their composition, molecular weight and intrinsic viscosity measured.
This work was performed by Celares GMBH, Germany with samples provided by DIGNA BIOTECH, Spain
The last few years have seen a high level of growth in the biopharmaceutical market, using biological molecules as drugs. As this market has grown, so has the demand for higher levels of characterization of these molecules.
One possible modification of protein drugs, or biologics, is their conjugation with a polyethylene glycol (PEG) molecule. So called PEGylation is known to improve half-lives leading to greater efficacy and reduced dosing frequency.
Size-exclusion chromatography (SEC), also known as gel-permeation chromatography (GPC), is regularly used to characterize proteins in solution, for instance to study their molecular weight. In particular, light scattering is used to measure absolute molecular weight independent of column retention volume. This is particularly useful for conjugates which will elute at radically different elution volumes than might be expected based simply on the protein's molecular weight. Furthermore, multi-detector SEC can also be used to characterize the composition of a conjugated molecule. This therefore allows the user to calculate the mass of each of the protein and PEG components. In this way, the PEGylated protein molecule can be completely characterized.
In this application note, one protein, interferon α-5, was conjugated with two different PEG molecules in different reactions. The protein and PEG molecules were characterized individually using multi-detector SEC, followed by the PEGylated conjugates. Their composition, molecular weights and intrinsic viscosities were measured.
The samples were separated on a Viscotek TDAmax system from Malvern Instruments, with refractive index (RI), ultraviolet (UV), light scattering (LS, SEC-MALS) and intrinsic viscosity (IV) detectors.
They were separated using a YMC-Pack Diol-300 (300 x 8 mm ID, S-5µm) column. The mobile phase was phosphate buffered saline containing 5% v/v isopropanol to reduce hydrophobic interactions between the sample and stationary phase. 20 - 30 µg of total material was injected for each measurement.
The chromatograms were analyzed using the conjugate analysis in the OmniSEC software. The conjugate analysis uses the responses from the RI and UV detectors to deconvolute the contribution of the two components (protein and PEG). The total signals observed for each detector are defined by the following equations:
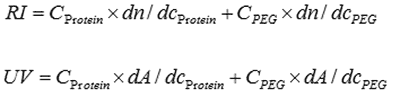
If the response factors for the detectors are known (dA/dc for UV and dn/dc for RI) for both components, then the concentration of each component can be calculated based on the signals from the UV and RI detectors. In this way it is possible to calculate the fraction of each component in the complex. The addition of light scattering adds the ability to measure the molecular weight of the complex and thus the mass of each component.
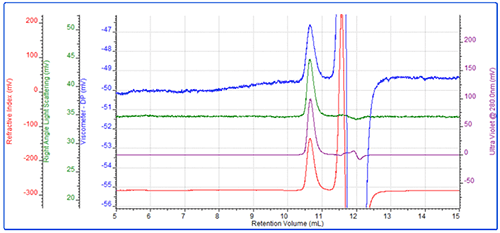
The first sample measured was the protein interferon α-5. This eluted after approximately 10.5 mL in a single peak with a measured molecular weight of 21 kDA. As expected, the conjugate analysis showed that this sample was 99% protein. Intrinsic viscosity was also measured and this was found to be 0.0334 dL/g and its hydrodynamic radius (Rh) was 2.2nm. The multi-detector chromatogram is shown in figure 1.
|
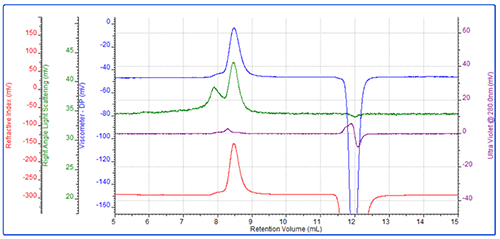
Following this, the first PEG sample, PEG-1, was run (Figure 2). This resulted in a main peak at approximately 8.5 mL and a secondary peak eluting at 8 mL. The main peak had a measured molecular weight of approximately 28 kDa and an intrinsic viscosity of 0.364 dL/g. Rh was 5.5 nm which is typical for this molecule. As expected, the conjugate analysis showed that this sample was 1% protein, so was effectively pure PEG.
As demonstrated by the relatively large light scattering signal, the secondary peak represented a small amount of aggregated material.
|
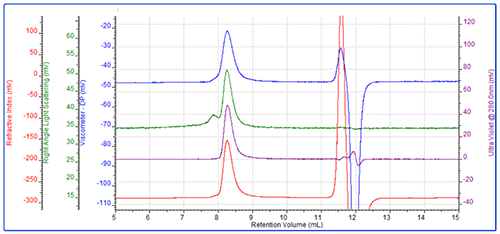
The conjugate was then analyzed. This sample eluted as a main peak after approximately 8.2 mL with a small secondary shoulder (Figure 3). The main peak had a molecular weight of 46 kDa of which 48% was protein. A simple calculation shows that the conjugate is then comprised of approximately 22 kDa worth of protein and 24 kDa worth of PEG. This clearly indicates that this conjugate is comprised of 1 protein molecule conjugated with 1 PEG molecule.
For this molecule, the IV was measured to be 0.278 dL/g. While the molecular weight of the conjugate is the sum of the two molecules, IV is closer to representing the average. This value, which is between the protein and the PEG, is therefore reasonable. The conjugate's Rh was measured to be 6 nm.
As in the PEG chromatogram, there is a small secondary peak. Again, this represents some higher molecular weight PEG aggregate.
|
Table 1 summarizes the results of this analysis.
| Sample | Protein | PEG-1 | Conjugate |
|---|---|---|---|
| Mw (kDa) | 20.5 | 28.4 | 45.8 |
| Percent protein (%) | 99 | 1 | 48 |
| Intrinsic viscosity (dL/g) | 0.033 | 0.364 | 0.278 |
| Hydrodynamic radius (Rh) (nm) | 2.2 | 5.5 | 6.0 |
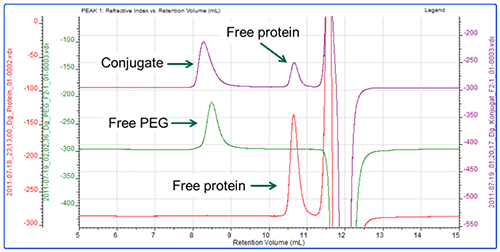
In the second experiment, the same protein was conjugated with a different PEG (PEG-2) using a different conjugation mechanism. Figure 4 shows an overlay of the RI chromatograms for the protein, PEG and conjugate. The red line shows the protein alone and is the same injection as shown in Figure 1. The green trace shows the chromatogram of the PEG alone. The purple line represents the conjugate sample which contains one peak in the region of the PEG and one in the region of the protein.
The analysis shows that the PEG-2 molecule has a molecular weight of approximately 33 kDa with almost no protein content.
The conjugate sample however is more interesting. This has been analyzed as 3 peaks. The peak at 10.5 mL elutes at the same time as the protein and has the same molecular weight. It is therefore clearly some free protein which has not been PEGylated. The peak at 8.2 mL has been analyzed as two regions. The main body of the peak has a molecular weight of 50 kDa, of which 45% is protein. This equates to approximately 22 kDa worth of protein and 28 kDa of PEG. This is a slight underestimate. The tail however, has a measured molecular weight of 37 kDa with 23% protein, which does not correlate with the known mass of the protein (Table 2).
|
| Conjugate | |||||
|---|---|---|---|---|---|
| Sample | Protein | PEG-2 | Peak 1 | Peak 1 tail | Peak 2 |
| Mw (kDa) | 20.5 | 32.6 | 50.3 | 37.6 | 21.3 |
| Percent protein (%) | 99 | 5.5 | 45 | 23 | 96.5 |
| Intrinsic viscosity (dL/g) | 0.033 | 0.366 | 0.269 | 0.336 | 0.033 |
| Hydrodynamic radius (Rh) (nm) | 2.2 | 5.7 | 6.0 | 5.8 | 2.2 |
The explanation for these results is quite clear. In the second experiment, the conjugation between the protein and the PEG has been only partially successful. In fact, this reaction is known to be reversible or unstable. The conjugate sample therefore contains a mixture of conjugated material, free protein and free PEG. The free protein is well resolved, however the PEG and the conjugate have similar sizes so have only been partially resolved resulting in a tailing peak. The measured values for each side of the peak are skewed towards the other because of the poor separation but it is nevertheless possible to establish that the main body of the peak is comprised of the conjugate, while the tail contains the remaining free PEG.
The Viscotek TDAmax from Malvern Instruments was used here to successfully characterize the protein interferon α-5, two PEG molecules and two conjugates of the PEG. Using the combination of RI and UV detectors it was possible to calculate the concentrations of each component both alone and when in the complex. This was used in combination with light scattering to measure the molecular weight of the complex and thus the molecular weight of each component within it. The addition of the viscometer allowed the measurement of intrinsic viscosity, a measure of molecular structure, and hydrodynamic radius.
Despite the different outcomes of the two experiments with regard to the successfulness of the conjugation, it was possible to characterize the samples. In the first case, the protein was completely conjugated with the PEG. This gave a complex which was clearly the sum of its two parts. In the second case, the conjugation was incomplete, or partially reversible, meaning the sample contained conjugate as well as free PEG and protein. It was nevertheless possible to characterize this sample well. The free protein was successfully measured. The conjugate and PEG eluted very close to each other which affected the results when each were measured. However, it was still possible to at least partially identify the populations within the peak thanks to the conjugation analysis and the differing detector responses.
In this way, it is possible to characterize PEGylated proteins to a high level to better understand the successfulness of conjugation reactions and the composition of the conjugates themselves.