The delivery vectors used in gene therapy can be viral, non-viral and engineered vectors. In this work, we will focus on recombinant adeno associated viruses (rAAV).
In this application note rapid, accurate, and robust quantitative measurements of viral titer and full capsid content for AAV samples will be described. This study will demonstrate the capabilities of OMNISEC and Zetasizer Ultra for analysis of rAAV5 samples at different levels of genome loading and sample heterogeneity.
Please login or register to read more.
In this application note rapid, accurate, and robust quantitative measurements of viral titer and full capsid content for AAV samples are described.
Rapid, accurate, robust quantitative measurements of viral titer and % full capsid content for rAAV samples are an unmet need in gene therapy R&D and bioprocessing. In the study, we will demonstrate the capabilities of Zetasizer Ultra and OMNISEC for analysis of rAAV5 samples at different levels of genome loading and sample heterogeneity. This study will demonstrate the capabilities of OMNISEC and ZS Ultra for analyses of rAAV5 samples at different levels of genome loading and sample heterogeneity.
rAAV are a class of viral vector that is being investigated intensively in the development of gene therapies. In order to develop efficient rAAV therapies produced through controlled and economical manufacturing processes, multiple challenges need to be addressed from capsid design through identification of optimal process and formulation conditions to comprehensive quality control of drug substance and drug product.
These warrant growing requirements for fit-for-purpose analytics and extended characterization through orthogonal use of multiple technologies. The accurate quantification and characterization of rAAV’s inhibit the development and advancement of gene therapies. Addressing these challenges requires extensive characterization of rAAV samples with multiple assays including measurements of capsid count, full:empty ratio, particle size, aggregate formation, stability, genome release, and capsid charge. Typically, rAAV titer and viral load will be measured using a combination of ELISA, ddPCR, AUC and EM techniques. These methods are generally time-consuming, labor-intensive, and have questionable accuracy, thus new technologies need to be investigated.
Recent advances in multi-angle dynamic light scattering (MADLS) have enabled the rapid screening of AAV titers with key improvements in data quality over traditional single angle DLS systems (read more here).
In this work OMNISEC, a multi-detection size exclusion chromatography (SEC) system, is used to deliver key critical quality attributes (CQA’s) for nominally full and Empty rAAV samples. OMNISEC is a multi-detection SEC system which contains a refractive index (RI), ultraviolet (UV-Vis 190-900nm), and light scattering detectors which enable the absolute molecular weight, aggregation state, viral titer, and full:empty ratio of a sample to be determined. Importantly, unlike traditional UV, only SEC systems, all results are independent of column retention volume, or any standards used to calibrate the system. The key measurement parameters with corresponding CQAs that are measured using OMNISEC are highlighted in Figure 1.

Figure 1: Key parameters and Critical to Quality Attributes for rAAV analysis by OMNISEC
Commercial rAAV samples (rAVV5) were purchased as nominally empty and full rAAV5. The full rAAV5 contained pFB-GFP ssDNA with a known molecular weight (Mw) of 785 kg/mol. The sample had a defined viral titer of 2.5x10¹³ as calculated by qPCR and ELISA.
Chromatographic separation of the rAAV samples was achieved using a Superose 6 increase (10/300) with an isocratic flow rate of 0.8 mL/min and phosphate-buffered saline as the mobile phase. An OMNISEC system consisting of an OMNISEC RESOLVE (pump, autosampler, and column oven) and an OMNISEC REVEAL (refractive index, UV/Vis-PDA and right angle/low angle light scattering detector) was used to acquire the sample chromatograms. The samples were maintained at 4oC in the autosampler prior to injection. The column oven and detector module were maintained at a constant 30°C during this work.
Following separation, the samples were processed using OMNISEC v11 software which is fully 21 CFR compliant and offers turnkey analysis of all AAV CQAs. Compositional analysis determines the concentration and molecular weight of two distinct components within a sample. In addition, for AAV it will automatically calculate the percentage of full AAV within the sample and the viral titer. For the compositional analysis to work, it is necessary to know the refractive index increment (dn/dc) and extinction coefficient (dA/dc) of both components. In this case, the dn/dc of the capsid and the ssDNA is well known. The dA/dc for the capsid can be measured using OMNISEC and the dA/dc for the ssDNA is calculated from the sequence.
Total particle, Full particle, and Empty particle concentration can all be obtained using the following equations:
Ctotal = (ConcCapsidNA) ⁄ (MwCapsid)
Equation 1: Total rAAV particle concentration
Cfull = (ConcDNANA) ⁄ (MwSeq DNA)
Equation 2: Total Full rAAV particle concentration
CEmpty = Ctotal - Cfull
Equation 3:Total Empty rAAV particle concentration
Where, ConcCapsid is the concentration of the capsid in mg/mL as calculated, NA is Avogadro’s number, Mwcapsid is the molecular weight (g/mol) of the capsid as calculated, ConcDNA is the concentration of the DNA in mg/mL as calculated, and MwSeq DNA is the molecular weight of the ssDNA from the sequence. Therefore, using these calculated particle concentrations, the percentage of Full rAAV5 in a sample can be easily derived.
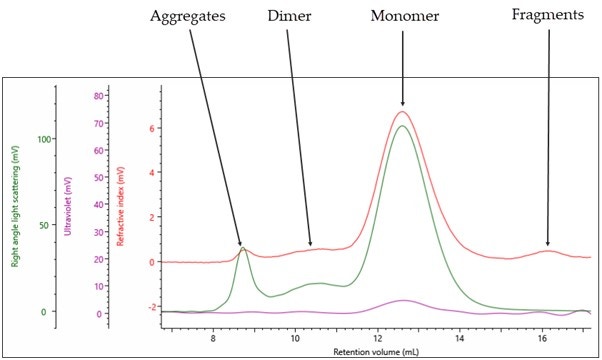
The multi detection chromatogram for empty rAAV5 is shown in Figure 2. The RI signal is represented by the red channel, the UV at 260nm by the purple channel, and the right-angle light scattering (RALS) detector by the green channel.

Figure 2: Triple detection chromatogram of rAAV5 (Empty). Red = RI, Purple = UV 260 nm, Green = RALS
As it has been labeled in Figure 2, the sample contains four populations: the main monomer peak at 12.5 mL retention volume (Rv), fragments at 16 mL Rv, dimer at 10.5 mL Rv and aggregates towards the void volume of the column at 8.5 mL Rv. Using the compositional analysis method, the data in Table 1 can be generated.
| Monomer | Dimer | Aggregates | Fragments | |
|---|---|---|---|---|
| Mw (g/mol) | 3.84x10⁶ | 6.98x10⁶ | 1.77x10⁷ | 821,849 |
| Mw/Mn | 1.001 | 1.010 | 1.175 | 1.695 |
| Fraction of Sample (%) | 84.7 | 7.2 | 2.7 | 5.4 |
| Fraction of protein (%) | 99.8 | - | - | - |
| Total Titer for sample (Monomer and Aggregate) = 5.91 x10¹³ vp/ml (2.6% RSD) | ||||
The key piece of data that is generated from a light scattering detector is the absolute molecular weight independent of column retention volume or any standards used to calibrate the system. In this case the Mw of the main monomer is 3.84x10⁶ g/mol. The theoretical molecular weight of the Empty capsid is 3.8x10⁶ g/mol confirming that this analysis is working as expected.
The Mw/Mn describes the dispersity of a sample, a value close to 1 suggests a single population within a peak, a value much higher than 1 suggest multiple populations within a peak. In this case, the monomer and dimer have values close to 1 suggesting single populations. The aggregates and fragments are significantly higher than 1 suggesting multiple populations with different molecular weights within the single peak.
The fraction of the sample describes how the sample is distributed between populations in the sample, in this case, 84.7% of the sample is a monomer.
The fraction of protein shows the percentage of capsid within the sample, in this case, the monomer is 99.8% capsid. This confirms that the sample is Empty rAAV5. The recoding of 0.2% DNA within the sample is likely due to the protein having minor absorbance at 260nm and can be taken as a source of error in any future %AAV-filled calculations.
The final critical piece of information we can obtain from this single analysis method is the sample titer, in this case for the Empty rAAV5 a titer of 5.91x10¹³ vp/ml was measured.
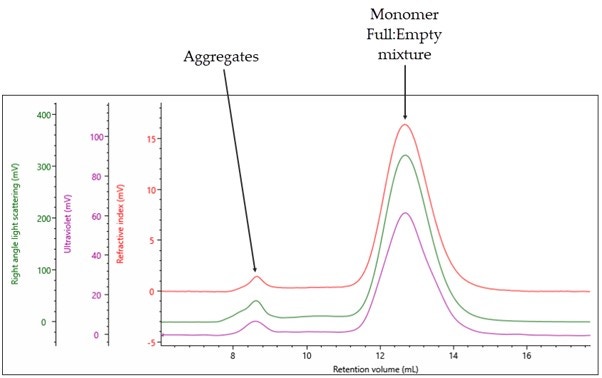
The triple detection chromatogram for Full rAAV5 is shown in Figure 3.

Figure 3: Triple detection chromatogram of rAAV5 (Full). Red = RI, Purple = UV 260nm, Green = RALS
A significantly different profile to that observed with the Empty rAAV5 is shown. In this case, there are only two distinct populations: the monomer peak, which is expected to contain a mixture of Full and Empty rAAV5 at 12.5mL Rv, and an aggregate peak at 8 mL Rv. Using the compositional analysis method, the data in Table 2 can be generated.
| Monomer | Aggregates | |
|---|---|---|
| Complex Mw (g/mol) | 4.49x10⁶ | 9.74x10⁷ |
| Fraction of protein (%) | 86.0 | - |
| Mw of Protein (g/mol) | 3.89x10⁶ | - |
| Mw/Mn | 1.00 | 1.22 |
| Fraction of Sample (%) | 93.2 | 7.0 |
| % Full rAAV5 | 78.1 | - |
| Total Titer for sample (Monomer and Aggregate) = 7.48 x10¹³ vp/ml (3.9% RSD) | ||
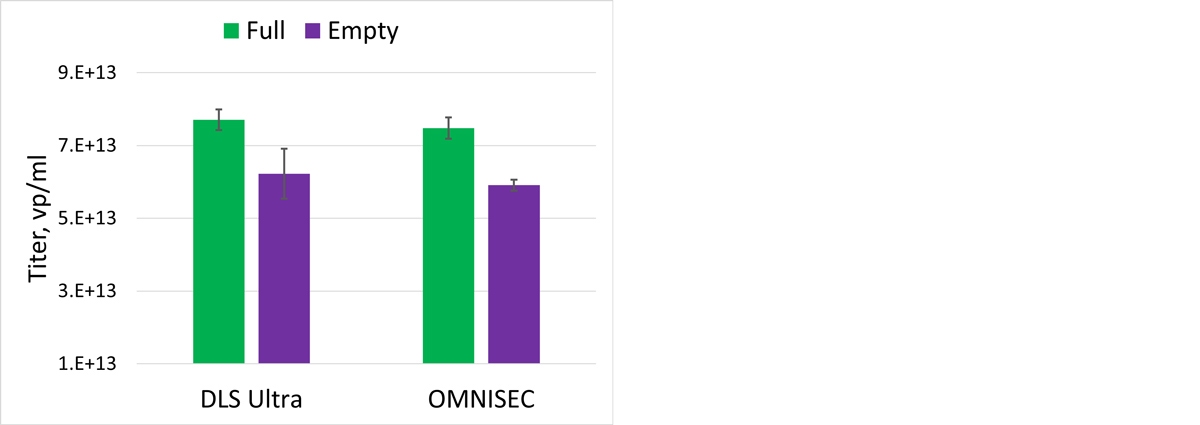
For the main monomer peak, a complex Mw of 4.49x10⁶ g/mol is calculated of which 86% was measured to be capsid. This gives the protein component of the filled rAAV5 an Mw of 3.89x10⁶ g/mol, which is in line with the data generated for the Empty capsid in Table 1. The monomer is 93% of the total population and the sample has a total titer 7.48x10¹³ vp/ml As previously described, it is possible to use MADLS to rapidly determine the viral titer. The data obtained from OMNISEC was compared with the particle titer from the Zetasizer Ultra, see Figure 4.

Figure 4: Comparison of rAAV titer using OMNISEC and MADLS
As can be seen in Figure 4, there is a good correlation between these two orthogonal techniques.
The key CQA parameter which can be calculated by OMNISEC is the percentage of Full rAAV5 in the sample. In this case, the monomer was found to be 78% Full rAAV5 with 22% Empty rAAV5. Importantly this analysis method assumes that the sample is either full or empty, it is not possible to account for part filled or overfilled particles.
To confirm the analysis of Full rAAV5 samples, the previously analyzed Full and Empty samples were mixed in controlled ratios. Table 3 shows the expected and the calculated % of Full AAV per sample. Figure 5 shows the plot of expected and calculated % Full rAAV5. As can be seen in Figure 5, a strong correlation between the expected and the calculated values were obtained confirming the reliability of OMNISEC to determine this CQA.
| Filled:Empty ratio | % full rAAV5 expected | % full rAAV5 calculated |
|---|---|---|
| 4:0 | 78.1%* | - |
| 3:1 | 58.6% | 64.5% |
| 2:2 | 39.1% | 43.6% |
| 1:3 | 19.5% | 24.3% |
| 0:4 | 0.2%* | - |

Figure 5: Plot of calculated and expected % Full rAAV5
The capabilities of OMNISEC for detailed characterization of rAAV samples were further evaluated in the context of a limited stability study where the rAAV5 sample was subjected to thermal stress. For selection of the stress condition we took advantage of the ZS Ultra’s high sensitivity to minor changes in the aggregation profile of samples and subjected rAAV5 samples to a thermal ramp between 25oC and 80oC.
The size of the rAAV5 sample was measured at each degree. Between 25oC and 35oC no change in size was observed. From 35oC an increase in size was recorded suggesting sample change (Figure 6A). The comparison of the data at 30oC and 45oC clearly shows the difference in the size between these samples (Figure 6B). The 45oC condition was selected for a limited stress stability study followed by high-resolution multiple-detection SEC.

Figure 6: Selection of thermal stress conditions for rAAV5 stability study. Thermal ramp with Zetasizer Ultra. (A) Size trend with temperature. (B) Overlay of size distribution by intensity at 30oC and 45oC clearly shows the difference in the size between the samples.
rAAV5 sample was incubated at 45oC and aliquots taken at 2, 5, 10, and 15 minutes for injection onto OMNISEC. The chromatogram (Figure 7) shows a clear change in the sample, increasing aggregation and decreasing monomer concentration. Table 4 shows that the complex MW remains stable during this incubation period as does the % full AAV in the monomer peak. This suggests that no population, empty or full, is being preferentially aggregated.

Figure 7: RI-detection chromatogram of rAAV5 samples incubated at 45 degrees centigrade and aliquoted at 2, 5, 10 and 15 minutes for injection onto OMNISEC.
| Stress time (mins) | Monomer Complex Mw (g/mol) | Monomer % full AAV | Fraction of monomer |
|---|---|---|---|
| 2 | 4.42x10⁶ | 80 | 90.3 |
| 5 | 4.47x10⁶ | 79 | 80.6 |
| 10 | 4.48x10⁶ | 78 | 78.0 |
| 15 | 4.49x10⁶ | 81 | 77.5 |
Rapid, accurate, robust quantitative measurements of viral titer and % full capsid content for rAAV samples are an unmet need in gene therapy R&D and bioprocessing. In the study, we have demonstrated the capabilities of Zetasizer Ultra and OMNISEC for analyses of rAAV5 samples at different levels of genome loading and sample heterogeneity. In addition, we have explored and demonstrated the value of orthogonal use of Zetasizer Ultra and OMNISEC as label-free assays not requiring AAV calibration standards, extensive method development, or dedicated reagents to report on:
The analysis of rAAV5 samples using Malvern Panalytical’s OMNISEC multi-detection SEC system in combination with the Zetasizer Ultra has provided the key critical to quality attributes (CQAs) of:
While many of these parameters can be determined using traditional biochemistry methodologies, OMNISEC offers a simple, reliable method with fewer external factors that can influence results.