Nanosized plasma membrane vesicles secreted by cells into bodily fluids are known to have an important role in intracellular communication. These little messengers, called exosomes or extracellular vesicles (EVs), are undergoing intensive research to prove their potential uses within diagnostics and as therapeutics. This research often involves characterization of a large number of exosome samples. Reliable physical characterization throughout the exosomes development workflow is crucial to fully understanding their formation, pathways, stability and responses to changing conditions.
Over the last few years, accompanying the exponential growth in exosomes research, NanoSight Nanoparticle Tracking Analysis (NTA) data has become an essential element of EV physical characterization. NTA-generated size and concentration data supports scientists through various processes in the exosomes characterization workflow, including purification, stability and storage studies. Promising discoveries, from early-stage fundamental research through to clinical trials, direct research towards understanding exosomes pathways. These studies are always accompanied by monitoring of the changes in the physical characteristics of samples. As growth in exosomes research accelerates, so the demand for quick, robust and accurate data continues to increase.
Addressing the need for higher throughput vesicle characterization and appreciating the demands on the time of exosome researchers, Malvern Panalytical has developed the NanoSight Sample Assistant (Figure 1). Robust autosampler hardware is accompanied by bespoke, user-friendly software. The NanoSight Sample Assistant suite offers improved measurement repeatability and reproducibility, and enables walk-away analysis of up to 96 samples in a single run. Flexibility to allow multiple experiments within one run is supported by the intuitive software interface, including visual sample plate animation. Experiment setup is fast, requiring less than 30 minutes of hands-on user time, and is assisted by guided, easy-to-follow workflows. Complete analysis of an entire 96 well plate can be completed in approximately 15 hours (3x 60 second captures per well in flow mode).

Figure 1: NanoSight Sample Assistant suite of autosampler hardware and bespoke software for the NanoSight NS300 instrument
For an early-stage exosomes researcher, the number of samples available may be relatively small, commonly between 10 or 20 samples per study. During the development of an isolation scheme, determining the yield and purification for each step assists in the optimization process, but can be laborious due to the numbers of samples involved. As knowledge increases, hypotheses must be tested against growing sample numbers, which introduces an increased risk of measurement inconsistencies or sample instability, especially when studies may take weeks or months to complete.
Delivering analytical consistency and high reproducibility of results, the NanoSight Sample Assistant helps save time and effort in batch-to-batch comparison studies and confirmation of vesicle purity and isolation consistency. Smaller sample sets benefit from the ability to run several studies from one plate, whilst maintaining confidence in both methodology and results. For larger sample sets, information about sample behavior/stability over 15 hours or longer can be also extracted.
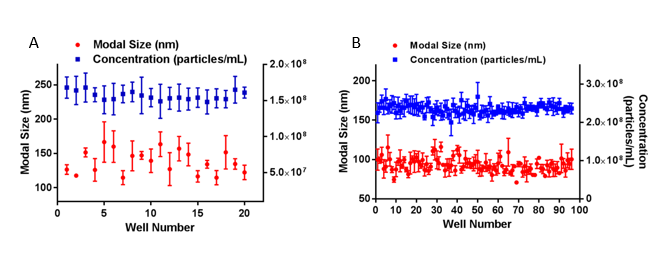
As a comparative illustration of small and large sample sets, exosomes from urine (Figure 2A) and SKOV3 cells (Figure 2B) were analyzed in separate experiments using the NanoSight with Sample Assistant. A single batch of exosomes from the urine of healthy volunteers were placed in 20 wells of a microplate, loaded sequentially using the NanoSight Sample Assistant and automatically measured by the NanoSight NS300 with 3x 60 second captures per sample, in flow mode, with analysis and data export included in the workflow. Size and concentration analysis of a larger sample set of 96 samples of exosomes from SKOV3 cells was performed as part of a separate study. All 96 wells were captured and analyzed under the same settings.
No significant changes in size or concentration were observed for either sample set over the respective experimental timeframes of 3 hours and 13 hours, confirming good sample stability in each case.

Figure 2: Average modal size (red circles) and concentration (blue squares) data for two sets of exosome samples: 20 samples of urine-derived exosomes (A), and 96 samples of exosomes from SKOV3 cells (B). Data are mean and the SEM derived from 3x 60 second analyses per well. The larger the sample set, the greater the user time saving, as illustrated in Table 1.
| Task description | Time required for analysis of 20 wells | Time required for analysis of full 96 well plate |
|---|---|---|
| Instrument time: capture | ~2 hours 35 minutes | ~13 hours |
| Total instrument time (initialization, capture, process, export) | ~3 hours 10 minutes | ~15 hours |
| Estimated user time (excluding sample preparation) | 30 minutes | 30 minutes |
| Estimated user time needed for manual measurements* | 10 hours (1.5 days) | 50 hours (10 days) |
| Estimated user time saving when using NanoSight Sample Assistant compared to manual measurements | 9.5 hours (2 days) | 49.5 hours (10 days) |
Table1: Estimated user and analysis time required for a small set of 20 samples, and a full 96 well plate, using the NanoSight Sample Assistant. Automated measurement times are compared to manual measurement times
*Estimates are based on manual NTA measurement taking 30 minutes per sample to load, measure and analyze and export data, then clean the system ready for the next sample
In a busy academic environment, multiple user demand for a single analytical instrument is often high. The NanoSight Sample Assistant allows multi-user experiments of smaller sample sets to be combined into the same single plate run, whilst maintaining the flexibility of individual experimental settings.
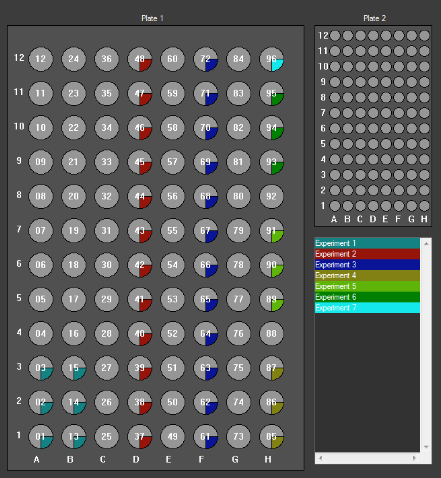
In the study described below, characterization of exosomes from four sources was combined with fractionation analysis in a single multi-experiment run. In this experiment, exosomes from plasma, human embryonic kidney cells, urine and SKOV3 cell culture supernatants were loaded to the microplate in the order and numbers shown in Figure 3. Each exosome type or fraction was then grouped into a single, color-coded experiment (Figure 3). For each individual experiment, capture and process settings were assigned. The entire sample analysis was then processed as a combined multi-experiment by NanoSight Sample Assistant, with the data export available in less than 7 hours.

Figure 3: Plate visualization showing a multi-experiment with samples from 4 users. Experiments 1 -3 contain exosomes generated by different users from different sources, and experiments 4-7 contain samples from the 4th user, representing exosome subpopulations.

Figure 4: Multi-experiment size and concentration data for 7 individual experiments, showing the difference between various exosomes types and fractions. Data are mean, with SEM and interquartile ranges shown
All size and concentration data can easily be compared, as shown in Figure 4. In addition, the data from individual experiments can also be extracted and compared, as shown in Figure 5. Individual experiments 4-7 represent exosome subpopulations. When all 4 experiments are compared, a difference in size distribution and concentration for various exosomes fractions is clear (Figure 5).

Figure 5: Comparison of size and concentration data for 4 exosomes fractions from an SKOV cell line, from experiments 4-7
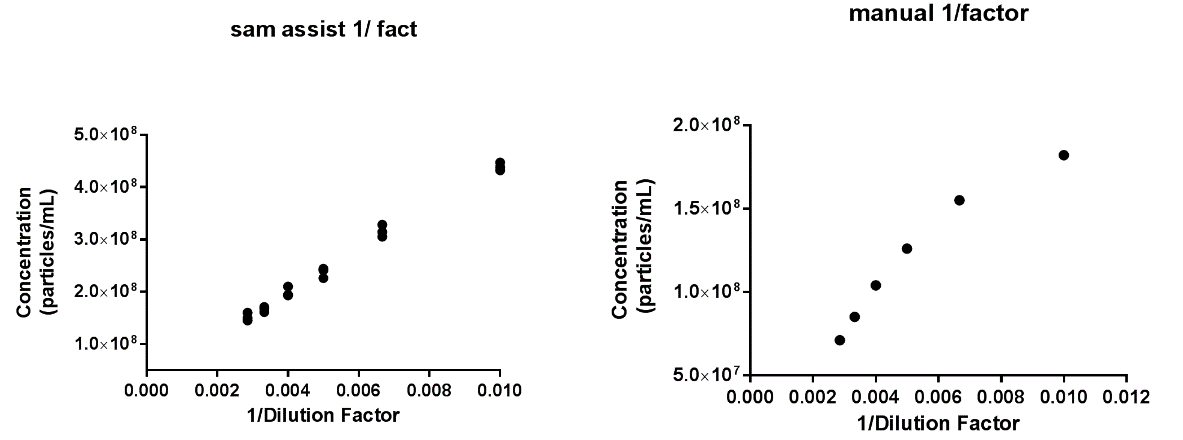
The NanoSight Sample Assistant was also used to investigate the concentration linearity of exosomes. In the initial study, manual measurements were performed on exosomes isolated from an SKOV3 cell culture supernatant. Exosomes were prepared at various dilutions, in particle-free PBS buffer solution (with 50x increments). Linearity in concentration was measured only in the very narrow dilution range of 100x -350x. For each dilution, 3x 60 second videos were captured under the same conditions in flow mode, and the same process settings were applied to all dilutions. The manual experiment time was approximately 7 hours, with an additional 60 minutes for sample preparation. A single dataset was generated for each dilution.
The experiment was then repeated using the NanoSight Sample Assistant. Samples representing each dilution were loaded into 3 wells (triplicate dataset) of a 96 well plate and the whole titration was done in a single experiment. The same capture and process settings were used across all sample dilutions. Using 3x 60 second video capture in flow mode, the total experiment was completed in under 3 hours, with an additional 60 minutes required for sample preparation, as before.

Figure 6: Exosomes concentration linearity: (A) fully manual analysis, and (B) analysis using NanoSight Sample Assistant
The results from both manual analysis and analysis using the NanoSight Sample Assistant are shown in Figure 6. It’s clear that more accurate and reproducible data is achieved by automated sample analysis. Automation allows the sample to be loaded at a fixed volume, imaged at the same fixed position and analyzed under the same settings, providing high reproducibility and confidence in the analysis method applied. Triplicate measurements assure the delivery of robust data. In addition, significant reductions in both user and analysis time were observed when using the NanoSight Sample Assistant.
The NanoSight Sample Assistant allows unattended NTA measurements of both small and large sample sets, saving valuable user time. With greater consistency in sample delivery, capture and analysis, data reproducibility is improved and the standard error is smaller, compared to manual measurements. User-friendly software with flexibility in experiment design and settings make the NanoSight Sample Assistant the perfect accessory for exosomes studies.
 The exosomes from SKOV3 cell line data used in this application note was generated in collaboration with the University of Oxford, Department of Physiology, Anatomy and Genetics, Le Gros Clark Building, South Parks Road, Oxford, OX1 3QX, UK.
 This project received funding from the European Union’s Horizon 2020 research and innovation program, under grant agreement No 646002.