The Zetasizer Auto Plate Sampler (APS) is a dynamic light scattering (DLS) instrument that automates the measurement procedure and enables measurements of multiple samples without the need of operator intervention.
The automation allows large amounts of data to be produced, which increases the importance of good data handling. The data display capability must enable the operator to easily retrieve the results of interest, without having to manually scan through all measurements.
In the new Zetasizer APS a new feature has been added to the software, called the plate navigator. This has the function of a data mapping tool which allows for the quick screening of results to retrieve the information of most interest and subsequent in-depth investigation of the data.
This application note highlights the features of the plate navigator and discusses how it can be used for sample analysis.
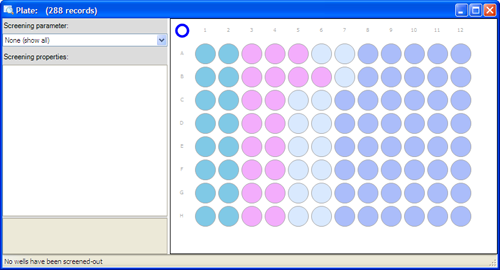
The Zetasizer APS results are summarized in the view called the plate navigator as seen in figure 1. This is a graphical overview of the plate and the results. In figure 1, no screening parameter has been selected. In this case the different colors show where different standard operating procedures (SOPs) have been used. A quick review of the data from the individual wells can be seen when the mouse is positioned over the well in question.
|
The plate navigator also enables the user to quickly screen the results based on one of a range of user specified parameters available.
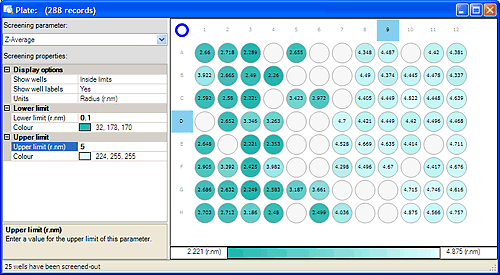
The screening parameter is chosen in the left part of the plate navigator. In figure 2, the chosen screening parameter is the Z-average radius. The data are shown as a gradient between two colors, the full gradient is shown in the lower part of the plate navigator with the limiting values displayed. The user sets the upper and lower limits of the screening parameter. The colors used for the limiting values can be specified by the user.
|
Under display options, the user can define whether the numerical labels are displayed in each well for the screening parameter selected. The units can also be defined for the parameter, in the case of the Z-average, there is a choice of displaying the value as the diameter or radius in nanometers for example.
In the lower left corner, the number of wells that have been screened out are shown. In the example shown in figure 2, 25 wells have been screened out.
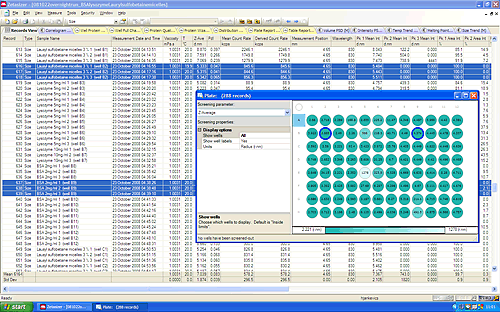
When a plate has been measured, the results are displayed in the record view as well as in the plate navigator, with each line in the record view corresponding to one measurement from one well. This enables the user to select specific wells in the plate navigator, shown as wells circled with blue rings in figure 3. The measurement records for these measurements are then highlighted in the Records View, allowing the user to study the results in more detail.
|
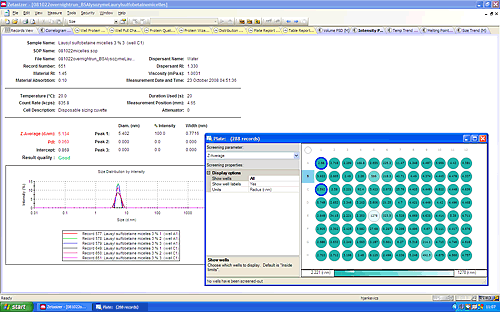
The plate navigator allows the user to overlay the results from selected wells in the various reports; one example is shown in figure 4, where the intensity distributions are shown for three repeat measurements with samples from two different wells.
|
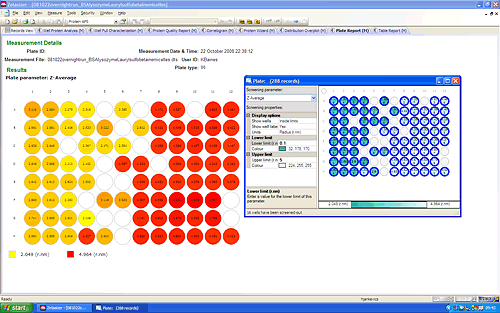
The Zetasizer software has an additional report available for APS data that allows the printing of the graphical display of the plate results. The user selects the wells to be displayed in the plate report with the plate navigator. In figure 5, a plate was screened based on the Z-average radius, with an upper limit on 5nm and a lower limit of 0.1nm. The round circle in the upper left corner in the plate graphic was pressed to select all the wells that fell within these screening values (highlighted by a dark blue circle). These wells then show up in the plate report with a color gradient making it easier for the user to identify samples of similar value.
|
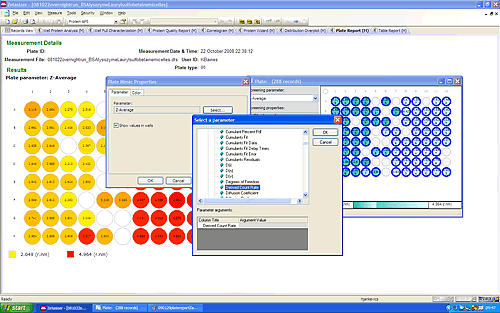
To select which parameter to show in the table report the user right-clicks on the Plate Parameter. Figure 6 shows how to change the parameter from Z-average to Derived Count Rate for example: The pop-up window : Plate Mimic Properties then allows the user to press the select button, to select the parameter to be displayed, in this case Derived Count rate.
|
The plate navigator tool in the Zetasizer APS software allows large amounts of data to be handled easily and rapidly. This application note has shown the different functions available and how these may help the user to screen their data and look at the results in depth.
There is a new report page in the protein workspace, the plate report, which allows a graphical output of the plate to be printed for record keeping.