Here, we will show how to separate the effects of a structural difference induced by a compositional change to a polymer (e.g. substitution) and the structural change induced by polymer chain branching, using OMNISEC.
The manipulation of polymer properties through changes in structure or derivatization is key to creating novel polymers with desirable physical properties. For instance, polystyrene is brominated to instill fire retardant properties for uses in consumer goods such as furniture.
While creating these polymers is a particular challenge, characterization of the polymers and derivatives created also presents difficulties. Gel permeation chromatography (GPC) is regularly used to compare polymer samples, conventional measurements based on a single detector only generate limited comparative data. Measurements with multiple detectors, though, allow for a more detailed characterization of polymers of all types.
The Mark–Houwink plot, which is one of the results from an advanced multi-detection GPC measurement, is a powerful tool for investigating polymer structure in solution as it clearly reveals the structure-molecular weight relationship with high sensitivity. It is generated by plotting the molecular weight (MW) against the intrinsic viscosity (IV) on a log-log graph. The molecular weight, of course, indicates the length of the polymer chains (or degree of polymerization) but on its own cannot give any indication of structure. The intrinsic viscosity (expressed in dL/g) is a measurement of the molecular density of the polymer chains in solution. The tighter the chains fold or coil in solution, the higher the density and the lower the intrinsic viscosity. This measurement is independent of the molecular weight, so two different structures having the same molecular weight can have different intrinsic viscosities – for example a linear (unbranched) polymer and a branched polymer of the same molecular weight will have different intrinsic viscosities. Furthermore, if the polymer changes structure across its molecular weight distribution (e.g. becomes more substituted), the intrinsic viscosity changes will be easily detected. This is what makes the Mark-Houwink plot so useful and powerful.
The raw data for the Mark-Houwink plot is conveniently and simply obtained from high quality multi-detection GPC/SEC data by combining the molecular weight from a light scattering detector with the intrinsic viscosity from a viscometer detector. Both data sets are measured at each point across the elution profile of the sample. The resulting plot can be used in many ways from simply assessing how close two structures are to making complex quantitative measurements of polymer branching.
In this application note, we will show, using polystyrene, how to separate the effects of a structural difference induced by a compositional change (bromination) and the structural change induced by polymer chain branching using the Mark-Houwink plot.
Polymer properties
The physical properties and behavior of polymers depends strongly on the properties of the polymer molecules themselves. This in turn means that the polymer properties will also have an impact on the properties of finished products made from or containing polymers. The molecular weight and molecular weight distribution, molecular size, intrinsic viscosity and structure all affect how the polymer material will behave. The most common tool used to investigate these aspects of synthetic polymers is gel-permeation or size-exclusion chromatography (GPC/SEC).
|
Advanced GPC/ SEC
The principle of GPC involves separating the sample as it travels through a porous but inert chromatography column matrix. While smaller molecules penetrate the pores more deeply, larger molecules are excluded and thus travel through the column faster. The result is a separation based on hydrodynamic volume. The basic data is simply a concentration profile of the size-separated sample but by using a multi-detector GPC/SEC system that combines light scattering, refractive index (RI), ultraviolet (UV) and intrinsic viscosity (IV), a large amount of information about a sample can be determined simultaneously.
|
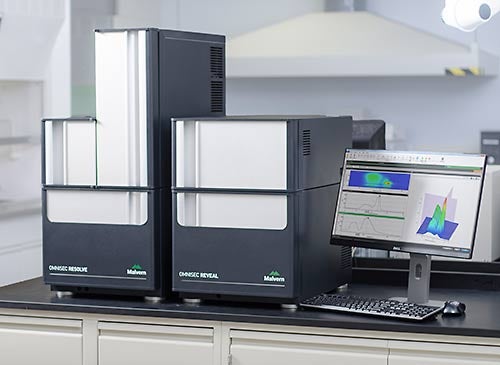
Samples were separated using two Viscotek T6000M columns. The mobile phase was THF stabilized with 300 ppm BHT. Samples were allowed to dissolve overnight to ensure full dissolution. The data in this application note was generated using the completely new Malvern OMNISEC system shown in Figure 4. The OMNISEC system was set up as follows:
Flow rate: 1.0 mL/min
Autosampler temperature: 15 °C
Column oven temperature: 35 °C
Detectors temperature: 35 °C
All system control, data acquisition, data analysis and data reporting were performed using the new OMNISEC software v10.
The three polymer samples analyzed were all polystyrenes. The first is a linear (unbranched) polystyrene, the second a star-branched polystyrene and the last a brominated linear polystyrene.
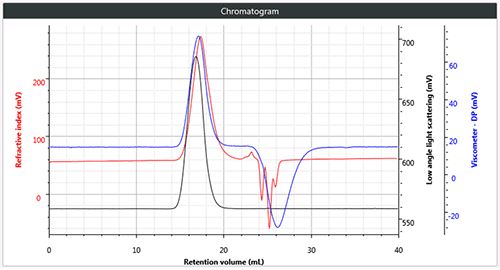
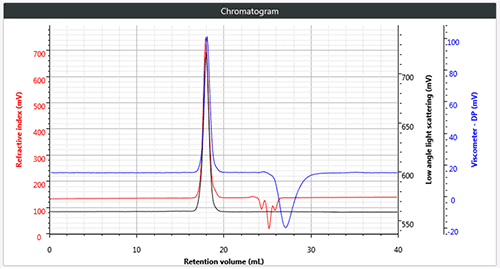
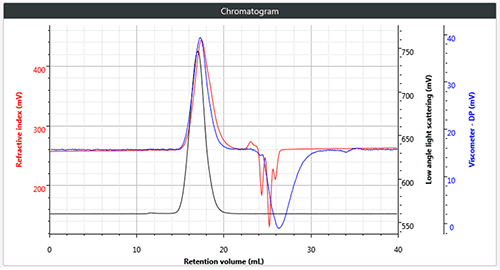
All three polymers are easily and successfully chromatographed under these conditions and a triple detection chromatogram of each of the three samples is shown in Figure 1, in each case showing the right angle light scattering (RALS), low angle light scattering (LALS), RI and viscometer signals.
|
|
|
In addition to these detectors, data was also collected on the UV-vis photo-diode array detector in the OMNISEC system (UV-PDA). This collects high quality spectral data at each data point and allows sample identification and differentiation. Table 1 shows the numerical results for duplicate injections the three samples and from this it is clear that the branched and brominated samples have a different molecular weight to intrinsic viscosity ratio.
| Parameter | Polystyrene samples | ||
|---|---|---|---|
| Linear | Star branched | Linear brominated | |
| Retention volume (mL) | 17.360 | 17.943 | 17.447 |
| Mn (Da) | 108,810 | 114,650 | 262,240 |
| Mw (Da) | 237,090 | 123,120 | 541,850 |
| Mz (Da) | 371,520 | 133,050 | 970,640 |
| PD (Mw/Mn) | 2.179 | 1.074 | 2.066 |
| Intrinsic viscosity (dL/g) | 0.832 | 0.451 | 0.282 |
| Rhw (nm) | 13.904 | 9.528 | 12.688 |
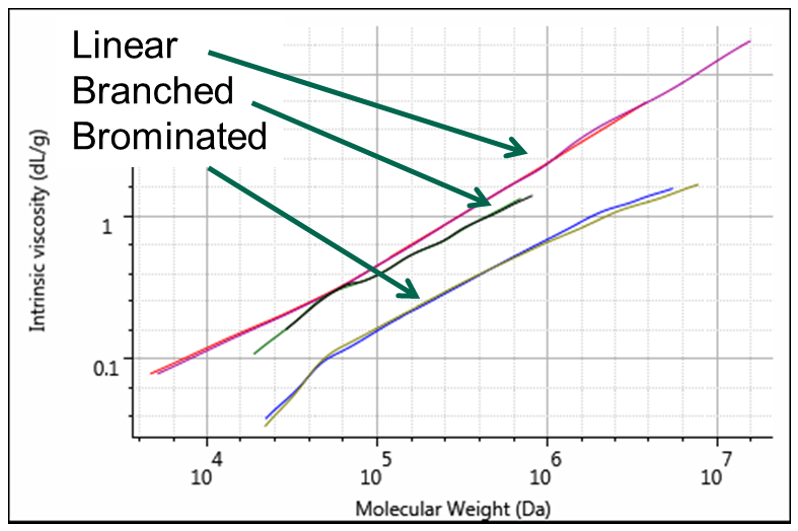
This is more fully illustrated in the Mark-Houwink plot for the three samples shown in Figure 2.
|
Here we can see that the linear polystyrene (in red) has the highest intrinsic viscosity (most open structure and lowest density). The star-branched polystyrene (purple) falls lower than the linear as the branching increases the density in solution. The brominated polystyrene (green) is the lowest on the plot as the intrinsic viscosity at any given molecular weight is much lower than the unbrominated samples. This is due to the substitution of the Hydrogen atoms (atomic mass = 1) on the styrene with Bromine atoms (atomic mass = 79.9) resulting in a much higher MW for the brominated chains without increasing the molecular chain length compared to unbrominated polystyrene. More mass in the same chain length will result in an increase in molecular density in solution and corresponding decrease in intrinsic viscosity.
Both the star-branched polystyrene and the brominated polystyrene have lower intrinsic viscosities but how can we differentiate the effect of substitution (bromination) and the effect of structural change (branching)? This is where we can use the spectral data from the UV-PDA.
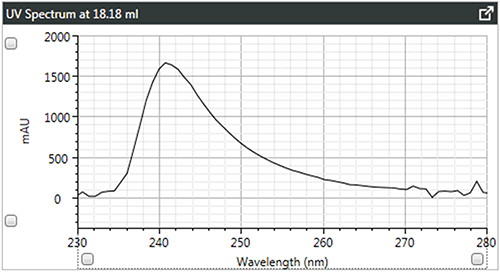
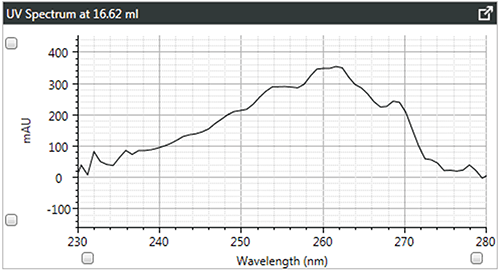
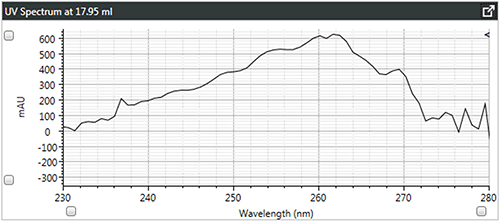
Figure 3 shows the UV spectra taken from the peaks of all three samples. It clearly shows that the spectra for the linear and branched polystyrenes are very similar; indicating that any difference in the Mark-Houwink plots is almost certainly due to structural changes, and therefore branching. In contrast, the brominated polystyrene spectrum is, as would be expected, very different from the polystyrene with the λ-max shifting from 262 to 241 nm, indicating its compositional difference.
|
|
|
High quality, high sensitivity multi-detection GPC/SEC data, such as that obtained here from the new OMNISEC system, can be a powerful tool in studying the effects of structural and compositional changes on polymers by using the Mark-Houwink plot. This application note has shown that the Mark-Houwink plot can be used to see structural changes such as branching independent of molecular weight and also differentiate that from compositional or substitutional changes by additionally using UV spectral data.
By understanding the precise structural or chemical changes induced in polymers during production using GPC and the Mark-Houwink plot, scientists and manufacturers are able to more fully understand, predict and control the final properties of the polymer under study. This leads to higher quality product, and higher quality polymer research.
|