
Size exclusion chromatography (SEC) and dynamic light scattering (DLS) are two technologies common to protein laboratories. SEC is routinely used for purification, identification, and quantification of protein mixtures, while batch DLS is routinely used for pre-column size & polydispersity measurements, along with aggregate quantification. The coupling of DLS & SEC technologies has been difficult, due in large part to the fact that eluted protein sample concentrations tend to be well below the detection limit for most DLS instruments. As shown in the following application note however, the latest generation of DLS systems, specifically the high sensitivity Zetasizer Nano from Malvern Instruments, has proven itself capable of handling this low protein concentration challenge.
Dynamic light scattering measures DLS intensity fluctuations to determine the size distribution of an ensemble of particles in solution. Size information is extracted from the measured correlogram by exponential fitting, where only the temperature and the medium viscosity are required.
Size Exclusion Chromatography SEC separates materials based on their hydrodynamic size. The elution profile provides insight into the distribution, and may be interpreted as a size distribution.
Combining the high resolution of chromatography with the ease of data acquisition from DLS can quickly identify or confirm peak identity.
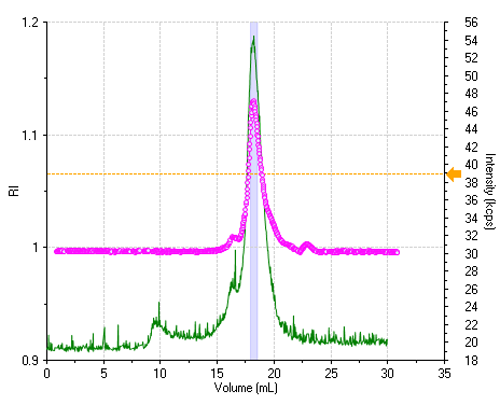
A Superdex 200 column (GE Healthcare, Uppsala, Sweden) was used for separation of Carbonic Anhydrase (Sigma), which had been prepared in PBS buffer at a concentration of 5 mg/mL. 100μL were injected, i.e. the column was loaded with 0.5 mg of protein. While the system was run at a flow rate of 0.5 mL/min, the differential refractive index signal (accumulated every 3 seconds) and the dynamic light scattering (accumulated continuously and analyzed every 3 seconds) were recorded.
The sample is reasonably monodisperse, leading to essentially a single peak in the elution profile. Figure 1 shows the refractive index (RI) and the light scattering intensity trace, where the two signals were lined up to take the delay volume (0.9 mL) between the two detectors into account.
All correlation functions are recorded; however, when the scattering signal is composed mostly of the buffer alone, the obtained data are meaningless. A display threshold allows selection of significant size results only and these are shown in figure 2.
|
|
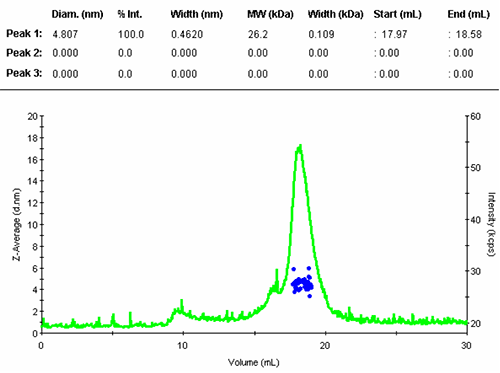
The numerical results of the automatic peak identification and fitting algorithm are in line with expectation. The resulting distribution function is measured directly from the elution profile of the measured size and without any assumption about the shape of the size distribution.
The single peak encompassed an average size of 4.81nm diameter, corresponding to an estimated molecular weight of 26.2 kDa for a globular protein. The peak start and end volume are automatically identified as 18.0 and 18.6 mL.
The molecular weight for this protein is 29 kDa, the result obtained here is in reasonable agreement with the expectation. The simple size measurement confirmed that the main elution peak was the monomer of Carbonic Anhydrase.
|